
By: Steven Abernathy
Download a PDF version of this article
Most medical professionals I talk to consider investment performance — annual returns — the most important element of their retirement portfolio. That’s an important consideration, of course, but of even greater consequence is lowering portfolio risk. Those who expect to be financially secure at retirement typically harbor some misconceptions, the most common being:
- Their investable assets will enable them to maintain their current lifestyle.
- Their investment portfolio will grow at least 12-15% a year.
- Their portfolio will make money every year.
Although common, these are dangerous assumptions.
How Much Will I Need?
It will take $5-6 million in investable assets for most medical professionals to retire comfortably, based on an annual after-tax return of 4%. This excludes residences and other non-liquid assets.
Inflation, even at a modest 3% annual rate of increase, means a podiatrist who currently requires $10,000 monthly income will need $16,000 per month just 12 years from now. It would take at least $4 million at 4% annual after-tax return to realize $16,000 per month, and that does not provide for increases in personal health expenses, which are likely. Then too, healthcare pricing pressures continue to lower payments to practitioners, who are faced with the choice of working harder to maintain their current lifestyle or accepting a reduced living standard.
What Rate of Return Can I Expect?
Are you staring at that 4% annual after-tax return estimate I used and saying, “My portfolio is going to do a heck of a lot better than 4% after-tax.” Welcome to misconception number two. In 20 years of speaking to healthcare professionals at seminars and conferences, I have yet to meet someone who does not overestimate what they will earn in the markets. Over the past century, the S&P 500 index has returned roughly 10% annually before taxes, a deceptive figure. There are management fees and transaction costs that typically eat up about 20% of returns. Most investment managers fail to match S&P returns, but even when they do, their clients face taxes that consume as much as 35% of the remaining gains. That leaves investors with the best-case reality of a 5-6% net annual gain.
There’s not much chance these averages will change much in the next 100 years. Investors who plan on after-tax annual returns of 12-15% are living a pleasant but improbable retirement dream. At 6% annual return over the past century, bonds are no better. Taxes knock that down to about 4% and inflation slices a little more off. Then there is speculation. Successful professionals consider themselves “above average” investors and speculate they will outperform the averages. They tend to have selective memory when it comes to investments: successes are permanent recollections, losses are forgotten.
I Don’t Plan to Lose Money
No one anticipates losing money, but few portfolios avoid losses. Even an occasional big loss can have a devastating impact on your investable assets, and the time required to make up that loss is much greater than you might think. Let’s say an aggressive investor with a high tolerance for risk — call her the “Hare” — has a terrific year. The stock market gains 12% but she makes 50%. Wow. The following year, the stock market drops 12% but the aggressive strategy loses 50%. A setback, sure, but she’s no worse off than when she started, right?
Chart 1
| Tortoise vs. Hare | ||||
| Year | Return | Aggressive | Return | Conservative |
| 0 | Hare | $1,000,000 | Tortoise | $1,000,000 |
| 1 | 50% | $1,500,000 | 6% | $1,060,000 |
| 2 | -50% | $750,000 | 6% | $1,123,600 |
| 3 | 6% | $842,700 | 6% | $1,191,016 |
| 4 | 6% | $840,270 | 6% | $1,262,477 |
| 5 | 6% | $893,262 | 6% | $1,338,226 |
| 6 | 6% | $946,848 | 6% | $1,418,520 |
| 7 | 6% | $1,003,670 | 6% | $1,503,631 |
Wrong. She is worse off — much worse off.
Assuming she began with $100,000, she jumps to $150,000 after year one, but in year two, her 50% loss leaves her with just $75,000 — a 34% loss which she has to make up just to get back to even. At an annual return rate of 6% — and that assumes she does not suffer another losing year during the makeup period — getting even would take five more years (see chart 1, the “Hare”). After seven years, our Hare has less than net zero performance once inflation is factored in. When this happens to people already retired, the impact is even more devastating because they are spending down their investable assets while their portfolio is simultaneously losing money. By comparison, a risk-averse investor (see Chart 1, the “Tortoise”) plods along at a steady if unglamorous annual return of 6%, reaching $150,000 after the same seven year period with no angst because his hedged portfolio is insulated against big losses.
Recognizing Real Risk
A podiatrist client of mine recently decided to move a portion of his equity portfolio to a “hot” manager he read about. The manager had outperformed our portfolio by 25% the previous year. I asked him what the manager’s capital at risk ratio was.
“I don’t know,” he said, staring at me blankly. “Look, his returns were higher than mine and his investment strategy seems comparable so the level of risk should be comparable too. That’s all I need to know.” Matter of fact, that wasn’t all he needed to know. His one-dimensional focus on investment returns ignored the historic data illustrating investors who chase the previous year’s hot manager rarely achieve superior returns. He would have been wise to put aside his preoccupation with higher returns for a moment and consider how much he might lose. The New York skyline is dominated by the glass and concrete edifices of banks and insurance companies. They have the money because their investment focus is on how much they might lose, not how much they might gain. It’s only after they are comfortable with the loss side of the equation that they turn their attention to the potential gain. That’s a proven formula for making money, one that few investors emulate. Like my podiatrist investor, most focus on what they might gain, overlooking the risk to investment capital.
Consider two portfolios:
Portfolio A
Return: 10%
Capital at Risk: 30%
Standard Deviation: 15%
Correlation: 40%
Portfolio B
Return: 12%
Capital at Risk: 100%
Standard Deviation: 40%
Correlation: 70%
An investor might intuitively choose portfolio B because the returns appear 20% higher. But Portfolio A, with just 30% of its capital at risk, is far less likely to suffer an annual loss than portfolio B. An investor with 100% capital at risk needs only a 25% mistake to be in serious trouble. Earning the same rate of return with just 25% capital at risk makes an investor far less vulnerable to market swings. Protecting core assets is vital because they are the basis for future gains.
Reducing Capital at Risk
A portion of your retirement portfolio should be in vehicles that do well in down markets. In recent years, even conservative institutional investors have shifted huge amounts from mutual funds and long-only managers to those who can hedge and profit in down markets. According to a front page story in the November 27, 2005 New York Times, “Pension plans and other large institutional investors are expected to invest as much as $300 billion in hedge funds by 2008, up from just $5 billion a decade ago.”
Hedge fund managers typically have less capital at risk than traditional or long-only managers, but how do hedging strategies lower the risk of losing capital? A simple example would be buying a stock at $100 and also buying a “put” at 90. If an unforeseen event occurs — a terrorist attack, oil embargo, the CEO goes down in a plane crash— and the stock plummets to 30, investors only participate in the drop down to 90. The exposure or capital at risk is limited to 10% of the portfolio versus 100% for an unhedged portfolio that bought the same stock at the same price.
A manager that hedges, like our firm, scans the market, looking for companies likely to outperform or underperform within each sector, going long on stocks we believe will outperform and shorting an equal amount on stocks we expect will underperform their counterparts. If a catastrophic event causes the market to collapse, no matter how smart you are or what you have done to protect it, the long portion of your portfolio is going to take a hit. But the stocks that were shorted also go down so the portfolio is stabilized and there is little or no overall loss. Much as a team of medical professionals works together to treat a complicated illness, understanding and defining what Warren Buffet calls your “Circle of Competence” is the key to building a team of competent advisors to help you navigate the years between today and your retirement. One member of the team is an investment advisor to help you construct various retirement scenarios, determine necessary annual contributions and manage assets within your personal risk tolerance and investment model preferences. There is no one “right” investment advisor for everyone. It’s important to know you and your advisors are all on the same page. Advisors with large amounts of money under management may seem like a safe choice but the more money a manager takes in, the harder it is to deliver performance above broad market returns. A record of minimizing capital at risk may be the most important consideration in choosing an investment advisor because you must always safeguard your investable asset base. There is no opportunity for future returns without investable assets. Seeking superior returns should be a secondary priority in retirement planning. Capital preservation should be the primary objective.
Two things you can do today to begin putting your retirement plan on track:
1) Adopt a long-term investment approach, a strategy that lowers the potential for crippling annual losses. If you are assuming annual returns above 6%, stop kidding yourself. The sooner you accept and implement a strategy embracing more realistic calculations, the better. Every year you delay making the adjustment is time you should have been saving more money that is lost forever.
2) Reduce your capital at risk. In most years, it’s better to have a 6% return with 30% of your capital at risk than a 10% return while risking all of your capital. The portfolio with the least capital at risk is best insulated against inevitable market dips.
Sidebar: It’s the Losses, Stupid
Remember the famous sign in Bill Clinton’s presidential election offices, “It’s the Economy, Stupid”? Perhaps every investor should have a similar sign on their desk, one that reads, “It’s the Losses, Stupid.” It would be great reminder to pay attention to portfolio capital at risk.
Chart 2
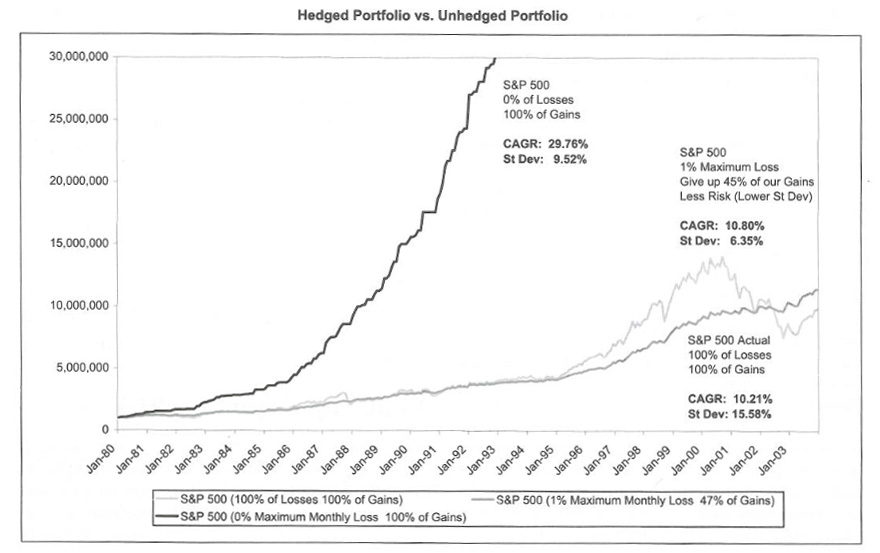
Take a look at Chart 2. It depicts three variables of a $1,000 investment in the S&P 500 index since 1980.
The black line is a projection of the S&P gains since 1980 without any of the losing months. Of course, that’s a purely hypothetic assumption since the S&P did have many losing months over the past quarter century.
The turquoise line depicts the actual S&P performance, including both gains and losses. A $1,000 investment in 1980 would have grown to about $10,300 — an average compounded annual return (CAGR) of 10.21%. Pay particular attention to the S&P’s Standard Deviation of 15.58%. It’s the key to evaluating capital at risk.
If you studied Statistics in college, you will recall that Normal Deviation, doubled by the Mean, encompass 95% of all outcomes. So to calculate the probably returns on the S&P, double its standard deviation of 15.58% (= 31%) and subtract that from the S&P CAGR of 10.2%, which equals -20%. On the high side, add the same double standard deviation of 31% to the 10.2% CAGR and you get +40%. The inference tells you that 95% of the time, the S&P will range between down 20% and up 40%. What it also should tell you is that S&P indexed portfolios spend way too much time in the negative area. That’s not where you want to be.
Now look at the dark green line representing a hedged portfolio that mimics the S&P index but with two important differences. First, when the S&P has a down month, the hedged portfolio is down, but not more than 1% because of the protection provided by hedging. In exchange for that reduced risk, our hedged portfolio gives up 45% of the gains!
Wait a minute. Give back 45% of the gains? That seems like a staggering amount to surrender just to lower our capital at risk, doesn’t it? Well, take a look at the hedged portfolio’s standard deviation and CAGR figures. Despite giving back almost half the gains, it actually outperforms the S&P slightly while reducing the standard deviation (capital at risk) by some 60%. The conclusion here is that you can give away almost 50% of the gains but if you avoid losses of more than 1% in any month, you will still outperform the S&P with much less risk. And avoiding losses is the real key to growing your portfolio.
Steven Holt Abernathy is principal and portfolio manager of NY-based The Abernathy Group, the nation’s largest asset manager exclusively for medical professionals. The firm specializes in asset protection and wealth management. The Abernathy Group has been ranked the number one money manager in the nation eight times in 12 years by Nelson’s Directory of Investment Managers. The firm offers Podiatry Management readers a free analytic tool to help determine the amount of assets needed to retire under various scenarios.