Footnotes will be a monthly publication which follows our “First Friday” webinar presentations each month. The goal of the Footnotes publication is to summarize our “First Friday” presentation’s most important data points, which will make it easier for The Abernathy Group Family Office members to make intelligent decisions based on facts and data – as opposed to potentially conflicted opinions – from the mainstream media.
Click here to view the corresponding First Friday Video
Commentary from the April “First-Friday” meeting:
April’s “First Friday” meeting focused on the market’s expectations that earnings for 2024-2028 will match the 10%+ growth rate delivered by the S&P 500 during the last 5 years. However, there is a problem with these expectations. The variables responsible for the last 10+ years of torrid growth are unlikely to be repeated. If those variables which created the tailwinds don’t reappear, earnings are unlikely to grow at 10%+ over the next 5 years, as the market is expecting. With current pricing at historically high levels, the U.S. economy slowing, tailwinds gone, and expectations high, the probability that earnings fail to meet expectations is higher than the market believes.
Read the “Footnotes” to understand why the tailwinds fueling earnings growth of over 10%/year over the last decade will be missing over the next decade (and what this means for investors).
As a short reminder to each Family Office member, The Abernathy Group Family Office has now had 12+ “First Friday” webinars. All of them are available on our website and “YouTube” Channel if you would like to go back and see how we have interpreted the economic signals, while doing our best to cancel the noise over the last year plus. Our goal: to help our Family Office members save time and make intelligent decisions by ignoring information with little predictive power and focusing on data with the highest probability of telling us what is to come.
Today, we are going to show you why the stock market is within 5% of an all time high, and why the world believes we are NOT going into a recession, yet the current data tells us, based on history, a recession is likely. The reason this is important: during recessions, earnings tend to decline. Today’s valuations need 10-15% growth per year over the next 5 years to satisfy current valuations.
Recessions mean headwinds are ahead for earnings. If earnings fall short of expectations, an already overvalued market could deliver a larger than expected price correction.
The world has forgotten that we have increased our U.S. debt to war-time levels. Of course, that is a problem, made more of a problem because we created this debt burden during the best of peacetimes. This will become a regrettable mistake and will disadvantage the U.S. for years to come.
We are going to clearly show you what the market is missing – or said differently, what the market is forgetting, and why this is important to every investor.
While no one knows exactly what will happen once the market comes to grips with “What it is missing,” we will explore what is likely to happen when the markets come to terms with reality.
—
The Goldilocks conditions of the last 20 years have delivered above average investment returns yet, have weakened our economy. This combination of higher asset prices and a more indebted economy has created unreasonable expectations, as you will see.
During each historical period of elevated U.S. economic growth, one can read the media hype supporting reasons for the “new era of permanently higher growth.”
Humans are naturally optimistic. Each time the narrative becomes “innovation has catapulted our nation into a permanently higher growth trajectory” we are soon reminded that the U.S. is a well-developed, mature nation. Growth rates above 2-3% are unsustainable, and while the “permanently higher growth rate” narrative may seem to make sense and may be what we want to hear, it is highly unlikely that “it’s different this time.” Growth spurts happen in every economy. Reversion to the mean typically follows.
At the turn of the 19th century, the development of railroads was a tremendous accelerant to U.S. GDP. Afterward, automobiles and the telegraph increased communication and brought the world closer together, which led to the first era of globalization convincing the world that we entered a new, permanently high growth era.
Then came the roaring twenties, where growth expectations were propelled by radio, motion pictures, and commercial air flight. Soon thereafter the semiconductor led to the computer, and eventually expectations of a new era based on commercialization of the internet, and the 2nd wave of globalization. Each wave of innovation ushered in a narrative that the U.S. entered a new era of permanently high growth.
Yet through all of the wonderful innovations and lifestyle improvements, U.S. GDP increased at less than 3% per year, and S&P 500 earnings growth also compounded at an average of just 2.7% per year.i
This historical look-back reminds us that every country and every economy go through periods of faster growth, slower growth, and at times recessions or negative growth.
It also reminds us that long periods of above average growth tend to be followed by long periods of below average and at times negative growth.
Our goal today is to identify where we are in our country’s cycle of periodic growth, and what to expect corporate America’s growth rate to be over the next 5-10 years.
Slide 2
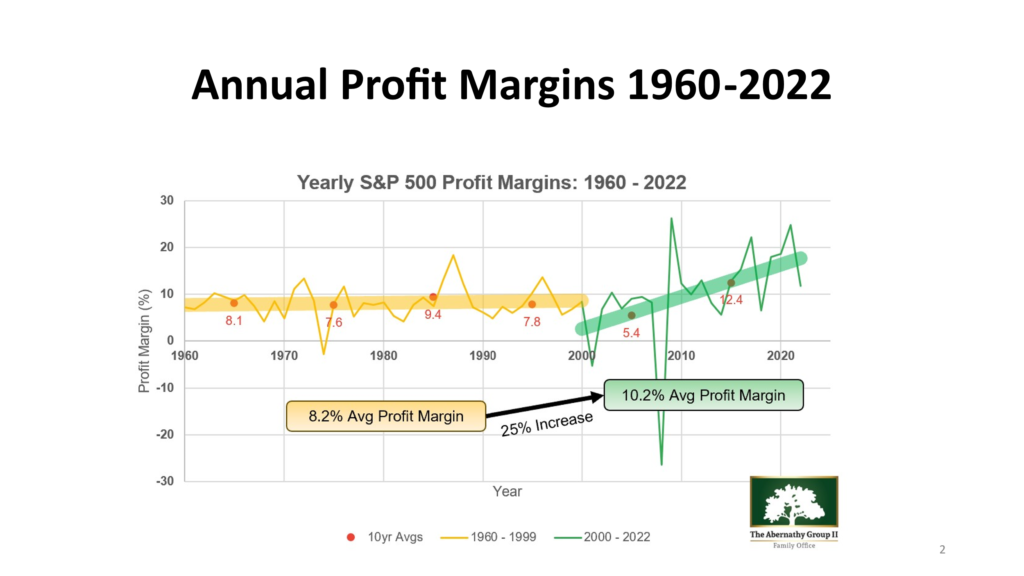
As you can see from the slide below, there was a significant change in corporate profit margins as the 1990’s ended. And when corporate profit margins increase, earnings usually increase. What caused this significant increase in profit margins? Is this development repeatable?
Today, the stock market is pricing in earnings growth of 10-15%/yr. for the next five or more years.
Is this a realistic expectation? Or is the market falling prey to “recency bias,” by extrapolating the last 5-10 years of exceptional growth far into the future?
Is “reversion to the mean” the more likely outcome?
As the chart above shows, a significant change took place between 1990 and 2022.
Profit margins increased by over 25%. In an emerging market economy, this might be possible. However, in a mature, developed economy, this is unusual, and begs the question, why? What allowed the U.S. to change so dramatically for the better?
Could it be that capitalism finally figured out how to wring more profits out of every company? Or could it be that external events shifted, and brought a magical benevolence to our corporate America?
We will explore this next, with an eye towards the most important questions below…
Can the changes which miraculously increased our operating profit margins over such a short period of time still be with us? And more importantly, can these increases be repeated, thus enabling our S&P 500 to continue its torrid growth?
Let’s first look at how increased profit margins affected corporate earnings -and if these events can be repeated …
So, let’s start with corporate earnings – which are the manifestation of profit margins. Remember, a financial asset’s value is related to the earnings it will deliver over its future.
Slide 3
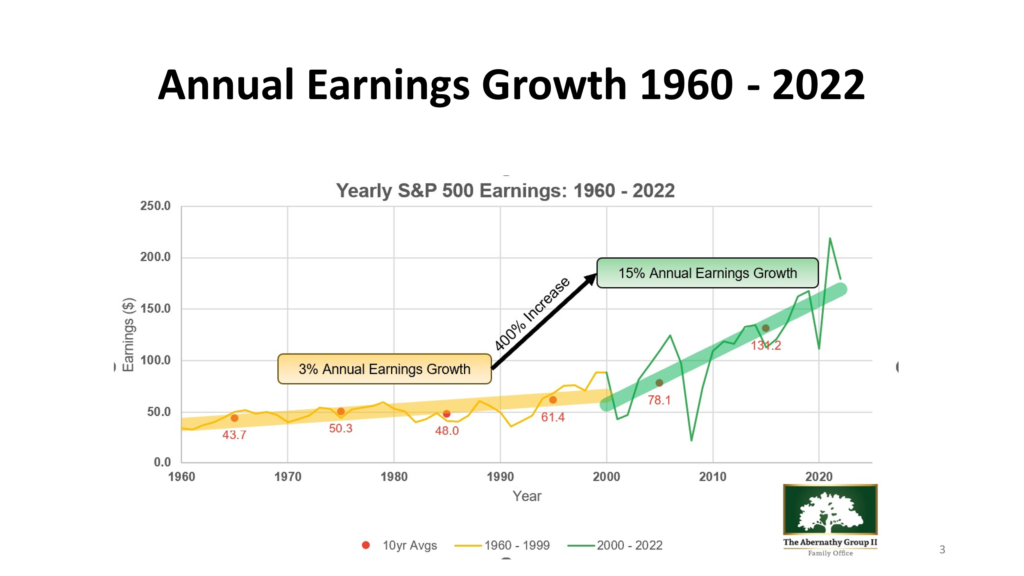
And what this chart shows us is that corporate earnings increased from a growth rate of 3-4% per year, to almost 15% per year!
That significant increase – is also an abrupt increase.
What would have created an increase in corporate profitability – of this magnitude?
Some would offer that the world of capitalism and the innovation engine of the U.S. finally figured out how to use the internet to increase productivity, thus profitability.
And we believe this has some merit. However, by the year 2,000, the internet had been part of our corporate lives for well over 20 years. This does not explain the explosion of profitability and earnings from 2000 to 2022.
As we explained in our 2022 webinar, the U.S. economy had some tailwinds which provoked incredible growth, which most have forgotten. These tailwinds are incredibly unlikely to be repeated.
Let go over these tailwinds.
Slide 4
Here is a chart showing corporate America’s debt increase over the last 15+ years.
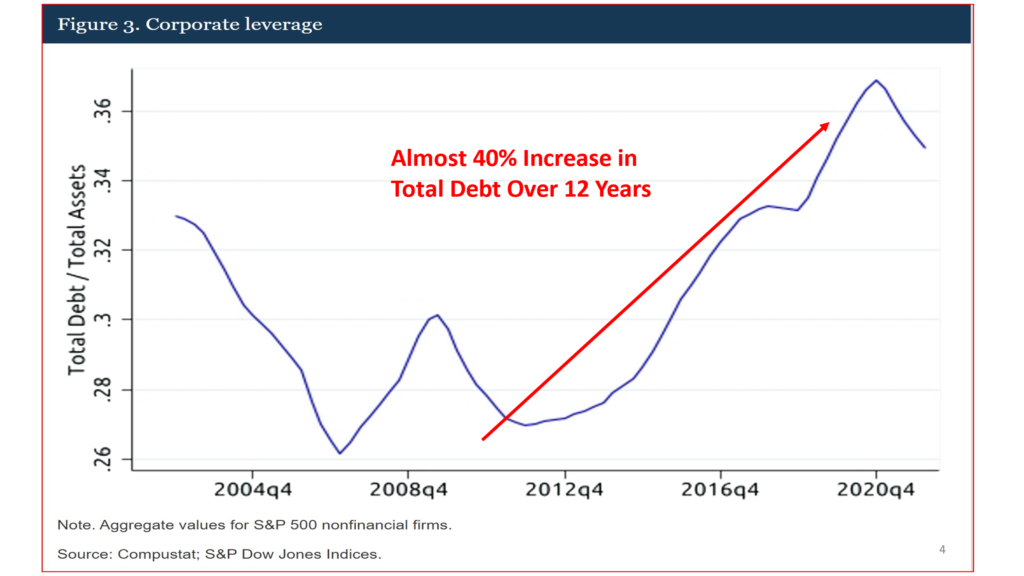
As we all remember debt increases leverage. Good outcomes become great, and bad outcomes become disastrous.
Over the last 15 years, the increased corporate leverage created a tidal wave of tailwinds which turned earnings growing at 3% per year into earnings growing at well-over 10%/year.
So increasing debt created tremendous benefits; however, corporate America had some helpers.
Slide 5
This chart shows that as Corporate America increased debt, the U.S. Federal Reserve was decreasing interest rates. While the U.S. Federal Reserve started decreasing interest rates after winning its inflation fight 1970’s and 1980s, the U.S. Federal Reserve continued lowering interest rates to levels seldom experienced in world history.
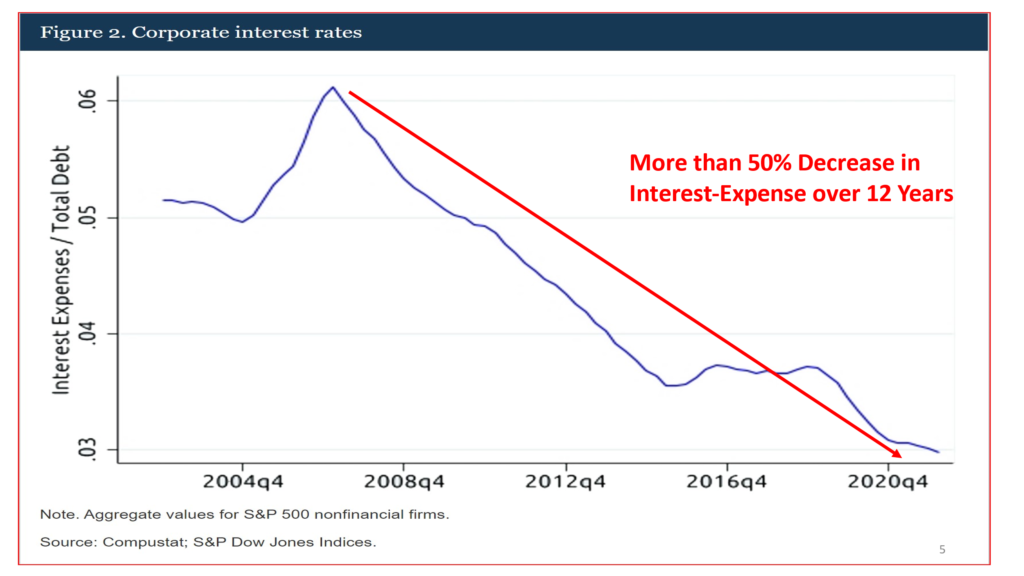
As corporate America increased its debt load to leverage financial performance, our country decreased interest rates, making it increasingly profitable for most companies to create more and more leverage. As interest expense decreased, the cost of this leverage decreased. This combination increased profit margins and earnings, as if on steroids.
Slide 6
Then the Great Financial Crisis hit us. It unleashed the world of bankruptcy on over 90 banks in less than 3 years along with hundreds of thousands of individuals and corporations – all with one commonality… speculative leverage.

This sent our economy into a period of repair lasting over ten years before we could regain our footing.
You would have thought we had learned something over that disastrous period.
And we did.
We learned that we could continue to issue debt, decrease the cost of the debt, and spend the money as if we were creating profits – as long as the world allowed us to continue this exercise in thoughtlessness. And that is what the world did. We continued issuing more debt as interest rates continued to fall, and higher profits followed.
Slide 7
However, just when you thought it could not get any better – there was one more benefit which fueled our corporate earnings growth and kept our goldilocks-economy going.
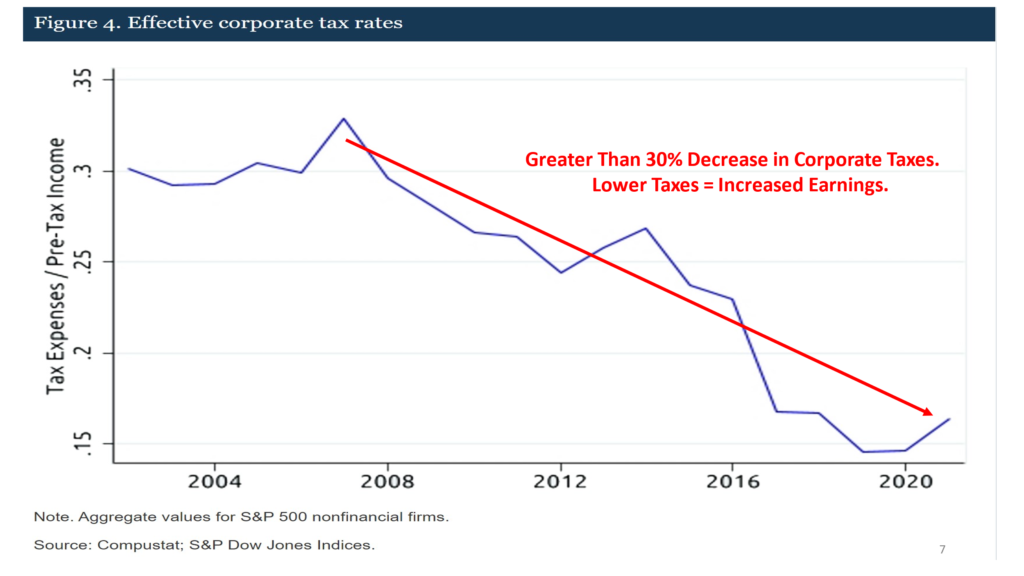
Corporate tax decreases. As many of you know from running your own company, there are few changes in corporate structure that create increased profit margins and bottom-line earnings more than tax decreases.
Now that we have gone through this short history lesson of data and its results, it’s easy to see why the outcomes during the 21st century produced such strong results.
Slide 8

Increased profit margins – produced =>
Slide 9

Increased earnings. Which led to =>
Slide 10
Stock market’s last decade’s performance has few historical parallels.
Now, let’s fast forward to today.
So, what is the market missing? The reason understanding what the market is missing is so urgently important, is because “the missing part” is not priced into the current valuations.
The market has priced in growth expectations for the next 5-10 years – we believe are completely unreasonable. Reason: The last 20 years of earnings have been aided by a) increasing leverage combined with b) decreasing interest rates and c) lower tax rates.
This combination created an almost free money drug – and this is ending.
Is it reasonable to believe the U.S. will continue to lower interest rates which will allow corporate America to increase debt? Is it reasonable to expect that corporate tax rates will be 30% lower over the next 20 years?
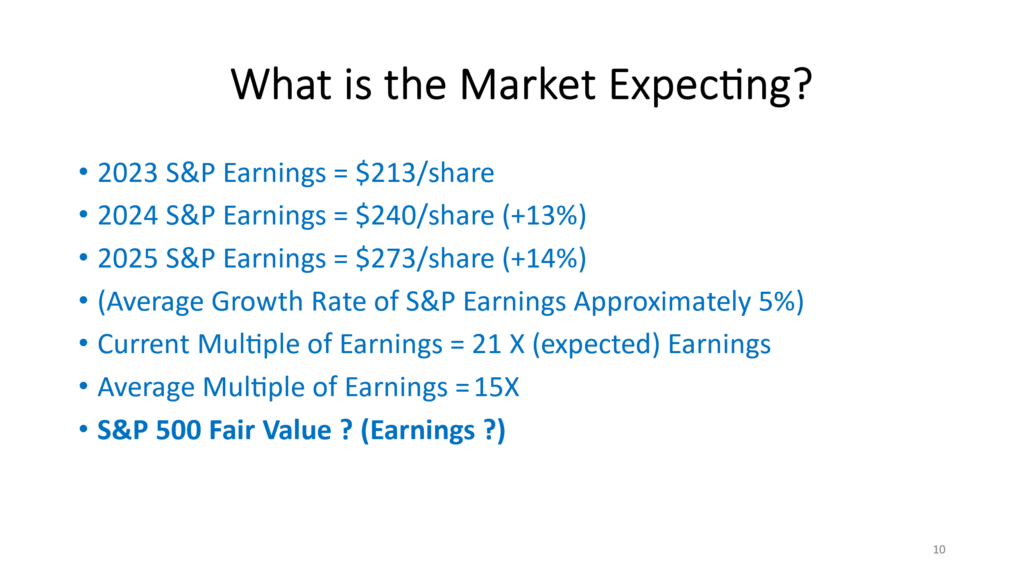
The first few questions every intelligent investor must answer: 1) what amount of future earnings is the stock market pricing into today’s current valuation? 2) is it likely that the stock market will be able to deliver those expectations? 3) Can this period of increasing leverage, decreasing interest rates and lower taxes be repeated?
Slide 11
The stock market is pricing in earnings growth of almost 13% in 2024, followed by an almost 15% growth rate in 2025.
These are growth rates we experienced during the last 20 years or so.
Unfortunately, the tailwinds which offered us incredible investment results over the last 20 years have shifted.
Almost every tailwind during the last 20 years may become a relative headwind over the next 20 years. Here is why:
Debt loads are unlikely to expand from current levels yet must now be repaid. Evidence clearly shows that high levels of debt slow economic growth, as resources typically used for growth initiatives, are diverted to pay interest and principal on debt.
Interest rates are unlikely to decrease from current levels. Now that debt levels have expanded, static interest rates offer no tailwinds, and increasing interest rates offer leveraged headwinds.
Tax rates have been reduced to levels which are much more likely to be higher in the future than lower. Tax rates are more likely to become a headwind than a tailwind for U.S. corporate earnings.
Intelligent investors realize the future is difficult to predict.
However, here are what we believe to be reasonable expectations for the future of our capital markets.
- Debt increases experienced over the last 20 years will not provide a tailwind over the next 20 years.
- Interest rates over the next 20 years will not experience the downward trajectory they experienced during the last 20 years.
- The combination of higher interest rates on elevated levels of corporate debt creates a headwind for risk assets.
- Corporate tax rates are unlikely to be lower over the next 20 years relative to today. Static or increasing tax rates create a relative headwind to risk assets.
- Good News: We believe there is likely to be innovation which allows our economy to become more productive. Artificial Intelligence dominates the current narrative. While we believe it will take time to realize the benefits of Artificial Intelligence, it will eventually create a tailwind for risk assets. However, reduced employment may be a side effect, and our economy will likely experience volatility as it searches for balance.
- Geopolitical conflagrations are also likely to play a part in our future. Unfortunately, no one is pricing in any significant geopolitical event. While no one knows the probability of a negative geopolitical event taking place, pricing-in no event is likely to be a mistake.
So where does this leave us?
Our guess is that earnings “revert to the mean,” meaning return to the more normal averages experienced over the last 50+ years or so.
With the market expecting earnings growth of more than 10%, the stock market is significantly overvalued relative to its average valuation. If earnings return to their normal range, stock market valuations should revert to their average valuation.
Our belief is that one of 3 outcomes will become clear over the next 5-10 years.
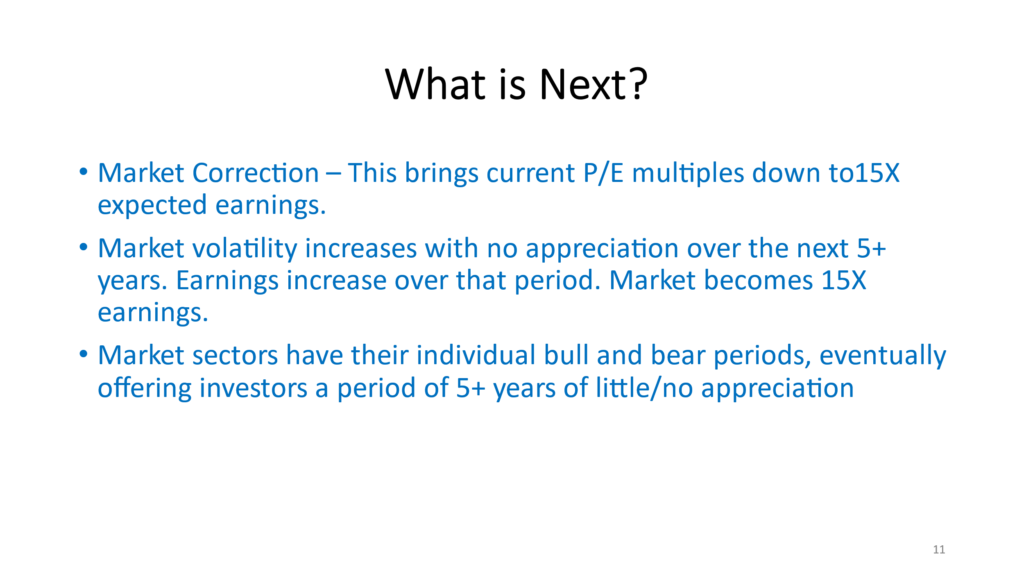
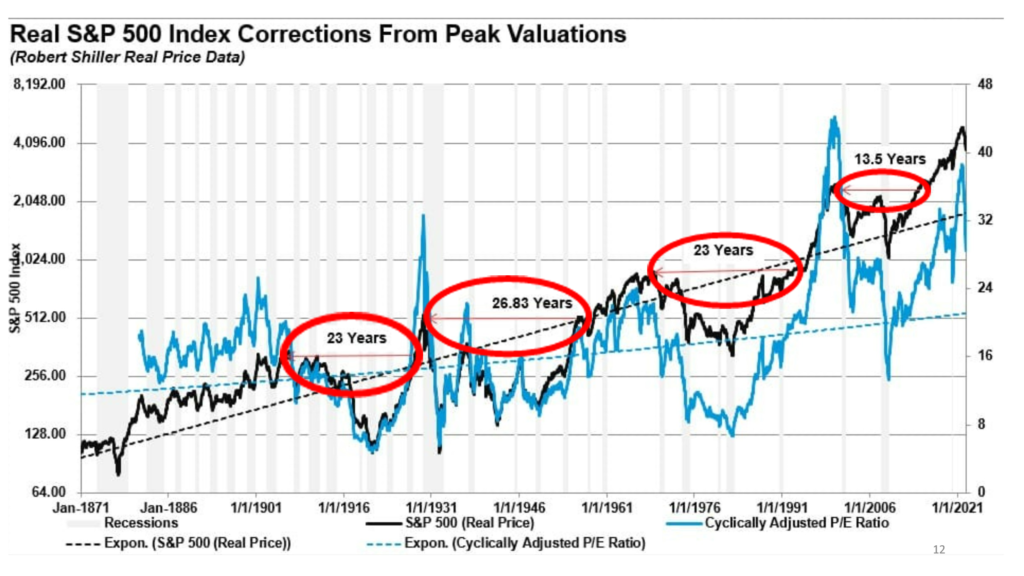
Slide 12
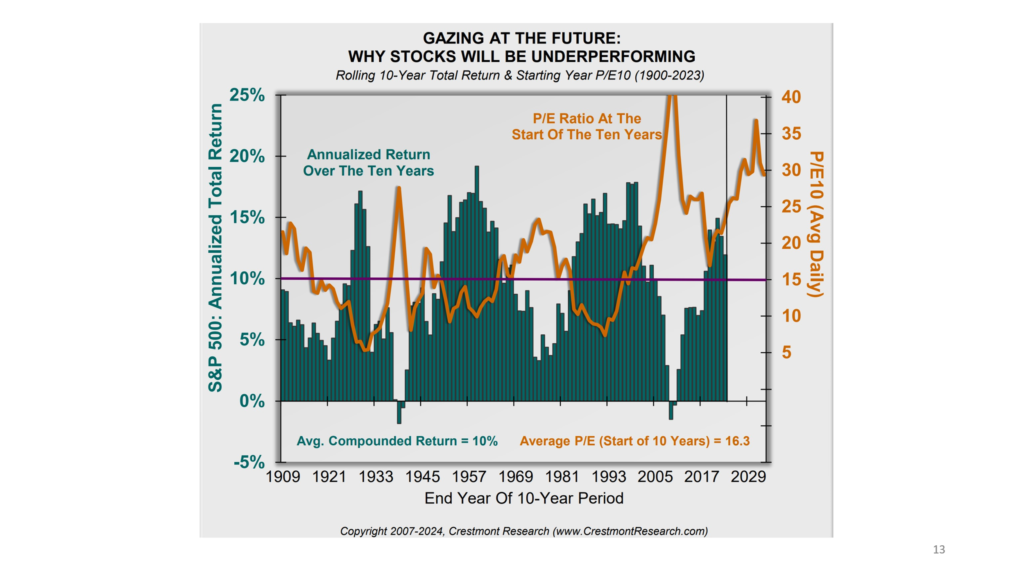
One potential option: The U.S. capital markets experience a significant decline in price which will eventually bring valuations back to normal – equivalent to the 15 X multiple experienced over the last 100 plus years. (The chart below is a courtesy from our friends at Crestmont Research. It shows a direct correlation between the “orange line” and the “green bar.” The “orange line” represents the price being paid for the average company in the S&P 500 10 years ago, relative to the “green bar.”) Ed Easterling, the owner of Crestmont Research calls this chart “Gazing into the Future,” as it is designed to show the relationship between overpriced securities and dismal or negative returns, and underpriced securities and attractive or desired returns. The relationship between the peaks of the “Orange Lines” and the “Green Bars” is self-explanatory and tells an important story. Overpaying today = low or negative future returns.
Another possible option: The narrative changes over the next few years. Volatility increases with the stock market churning up and down. Some industries prosper one year, only to give it back next year. The stock market goes no where for 5-10 years as corporate America repairs itself, leaving investors with investment returns generated only by dividends (currently 1.3%).
This possibility gives the U.S. economy, and the companies within the S&P 500, the ability to allow earnings to catch up to current valuations. Equally likely is the possibility that the stock market enters a rotational period where one sector is in vogue during the year only to become out of favor the next.
Over the last hundred years we have had at least 4 periods of more than 10 years of 0% appreciation, and at least 3 periods of more than 20 years of 0% appreciation. Few investors realize this.
What this means is an unpleasant point. We could easily enter a period where investors who are counting on appreciation for their investment returns, have no appreciation.
The only increase in their wealth may very well come from dividend and interest income. If they have not created an investment allocation which embraces dividend and interest income, it is entirely possible they will have no return during these periods of market recalibration.
The chart below shows both options taking place more often than most would believe.
These periods are much more painful than hindsight would suggest, as experiencing all of the risks of a very volatile market with no return for well over 10 years is enough to depress any investor… and depressed investors often begin to make decisions based on emotions rather than research and data. In short, while this option is as likely as not to solve our “overpriced market” problem, it could offer more pain than a significant downturn in order to bring valuations down to a level offering attractive future returns.
The most likely scenario? Over the next year something in our economy fails, which gives the U.S. Federal Reserve a reason to lower interest rates and/or allows our administration in Washington to continue injecting money into the U.S. economy.
This will create the equivalent of a sugar high with a return to normal – painfully awaiting. The problem: We didn’t deal with the elephant in the room – U.S. debt. Over the course of time the markets will price in our budget deficit and our increasing debt load. Interest rates will eventually rise (forced by the global markets, NOT by the U.S. Federal Reserve) and the multiples paid for U.S. companies will shrink back to 15 X earnings.
As our U.S. economy deals with constant overspending and its unsustainable debt load, combined with an overvalued stock market, investors expecting 10-15% per year appreciation are likely to be disappointed.
The final chart below is published by GMO. They are a high-quality research firm dedicated to allowing data to dictate activity. We have been using this chart for over a decade and can vouch for its predictive quality.
As you can see, this table clearly shows the U.S. capital markets are severely overpriced. Investors paying today’s prices should expect a) little or no return over the next 5+ years, or b) a severe downturn which allows overpriced assets to become fairly priced, or c) to have earnings grow at 10-15%/ year over the next 5+ years.
International and Emerging Markets offer a more welcoming valuation and are more likely to deliver reasonable returns for investors over the next 5+ years.

i According to the Shiller / Yale University website, earnings of $19.76 in 1900 growing to earnings of 195.93 in 2023 support a compound annual growth rate of (2.75% / year) under 3%/yr.