
Footnotes is a monthly publication that summarizes our monthly “First Friday” online seminar presentations. It aims to capture our webinar’s most essential data points, making it easier for The Abernathy Group Family Office members to make informed decisions based on facts and data, rather than potentially conflicted opinions from the mainstream media.
As a short reminder to each Family Office member, The Abernathy Group Family Office has now sponsored 20+ “First Friday” webinars. All of them are available on our website and “YouTube” Channel if you would like to go back and see how we have interpreted the economic signals, while doing our best to cancel the noise. Our goal: to help you spend less time making intelligent financial decisions, by focusing on causal, predictive data (signals); and ignoring the clamor of biased, irrelevant data (noise).
Commentary from the August 2025 “First-Friday” meeting:
Good afternoon, everyone.
My name is Steven Abernathy, and my co-host, Matthew Daley, and I will be your hosts today.
Let me welcome you to the Abernathy Group Family Office’s August 2025 “First Friday” meeting, titled “Short-Term vs. Long-Term – Is the U.S. Too Big to Fail?”
In our meeting today, we will focus on some of the economic differences between the short-term and long-term perspectives, as well as the impact the short-term dimension has on the long-term outlook.
One of the clear risks on the radar today is the valuation of the public market, mainly driven by technological advancements in Artificial Intelligence.
The impact of Artificial Intelligence has created a level of concentration in the stock market that we have never witnessed before. We believe this level of concentration is typically a risk in all markets; however, the extreme levels of concentration Artificial Intelligence has created today pose a level of risk not seen since the dot-com bubble in 2000.
While it’s true that this kind of technological advance typically occurs every 15-30 years, it is just as true that there will likely be some bumps along the way. Given our current levels of debt, these bumps could lead to second- and third-order effects… none of which are desirable.
As we mentioned in the last “First Friday” webinar, “We do not recommend attempting to time the markets; however, we strongly support avoiding overpriced assets because they offer little to no upside—and carry significant downside risk if the future, which is currently priced for ‘perfection,’ does not meet expectations.”
We want to clarify that the comments made during this meeting are intended solely for members of The Abernathy Group Family Office. Additionally, these comments are not meant to serve as investment advice for anyone outside our Family Office.
That said, I want to continue to make it clear – in our opinion, most public markets are currently priced at levels that will offer lower-than-average or negative returns over the next 5-15 years. Speculation is abundant, creating risk levels in some securities seldom witnessed in the public markets, and it may be even worse in the private markets.
Today, we will not record our prepared comments, as we hope to create a more open environment for questions and opinionated commentary.
Our comments today will last about 45 minutes, leaving us plenty of time to answer questions from everyone on the call.
* Please either type your question into the “Chat” box at the bottom of your screen or write it down and raise your hand at the end of the remarks by clicking the icon at the bottom of the screen.
The primary goal of this monthly meeting is to ensure that all questions are answered with sufficient data while avoiding the bias common among most Wall Street analysts.
As you are aware, we do not sell any products and have no incentives other than helping the families we serve make well-informed decisions.
So, please remember to send us your questions and comments.
One final NOTE: Please remember to “Mute” your device’s microphone and stay on “Mute” unless you have a question, as background noise can be heard and can be distracting.
Slide 2
That said, I’ll now turn it over to Matt Daley, who will be leading today’s presentation.
Thanks, Steven. There is a lot to cover today, so let’s get started.
Today, as Steven mentioned, we will discuss the valuation of private markets and aim to determine whether the price alone creates an unrelated risk for all investors.
We know, for instance, that Berkshire Hathaway and Mr. Buffett have the highest level of cash ever recorded for Berkshire… and we consider this a signal every investor should consider.
Next, we will review several of the many independent variables that could lead to a downturn in our markets.
And as always, we want to ensure that everyone’s expectations are well-grounded by discussing what history has offered investors when the market is valued at its current level.
And finally, we want to tackle one of the most important questions we have encountered in a very long time. And it’s one that the vast majority of analysts either dismiss or avoid.
The question: Is the U.S. too big to fail? And if so, what does that mean for the investing public?
We would greatly appreciate hearing from every member of the Family Office on this topic, as it could be a pivotal issue.
Slide 3
So, let’s get started.
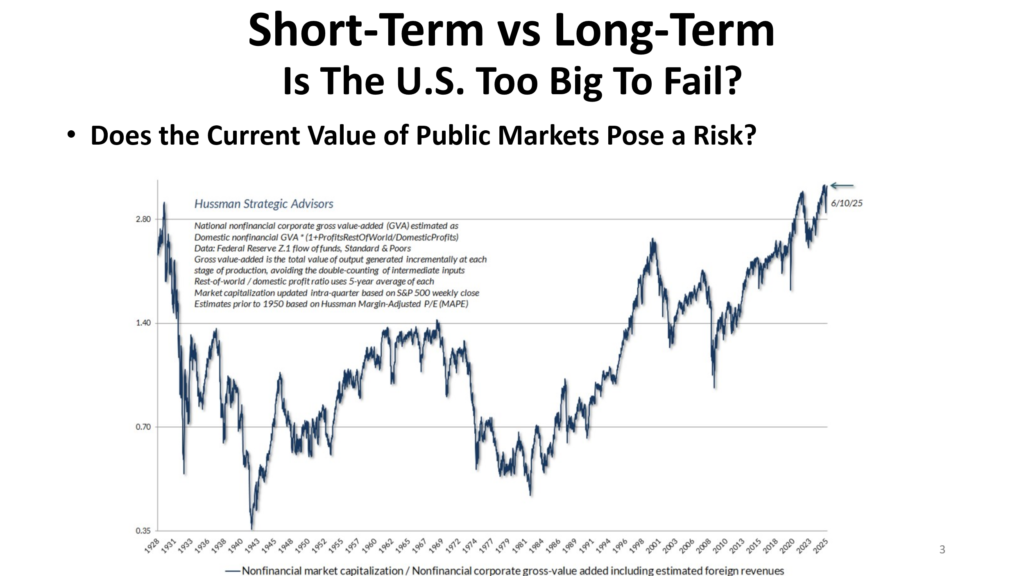
Steven, does the current value of the public markets pose an investment risk today?
Thanks, Matt.
That remains a question most of us are trying to answer.
Today, we are priced at record levels.
Our economy avoided a recession thanks to the U.S. government printing a huge amount of money and nearly dropping it from helicopters on Americans over the past 8 years.
And today, the investing public is counting on the U.S. Federal Reserve to step in and rescue investors each time our U.S. economy catches a cold.
And, as the title of our discussion today suggests, short-term this feels great; long-term, it is disastrous. Why? Because avoiding tough economic periods weakens the effects of “creative destruction,” which allows outdated companies to fail while the economy adjusts to innovation and technological progress, making space for new businesses.
This ongoing interference with our economy, which disrupts normal business cycles that cleanse and renew the economy, has significant negative effects on long-term economic growth in the U.S.
And unsurprisingly, the new administration that took office in January has kept the money flowing into the U.S. economy, preventing a long-overdue downturn.
Most estimates suggest our current administration will spend almost $2 trillion more than it earns in 2025, and for 2026, some projections estimate an additional $1.7 trillion exceeding our revenues. Printing money and injecting it into the U.S. economy creates the illusion of a healthy economy growing at a reasonable rate. Unfortunately, this is not the case.
As this chart demonstrates, the value of our public markets has reached an all-time high.
In short, we believe current valuations pose a risk to themselves. Investors who invest at these levels should expect very low or negative future returns.
Slide 4
This slide from a different entity shows the market’s currently overvalued structure.

We are entering a zone of significant risk. The risk may or may not materialize; yet, make no mistake, we are priced at levels that only make sense if the world unfolds perfectly, just as our investing public expects it to…
Anything less than perfection will create second- and third-order effects… none of which will be welcomed.
Slide 5
Here is a slide we discussed last month when comparing the dot-com bubble to today’s Artificial Intelligence bubble.
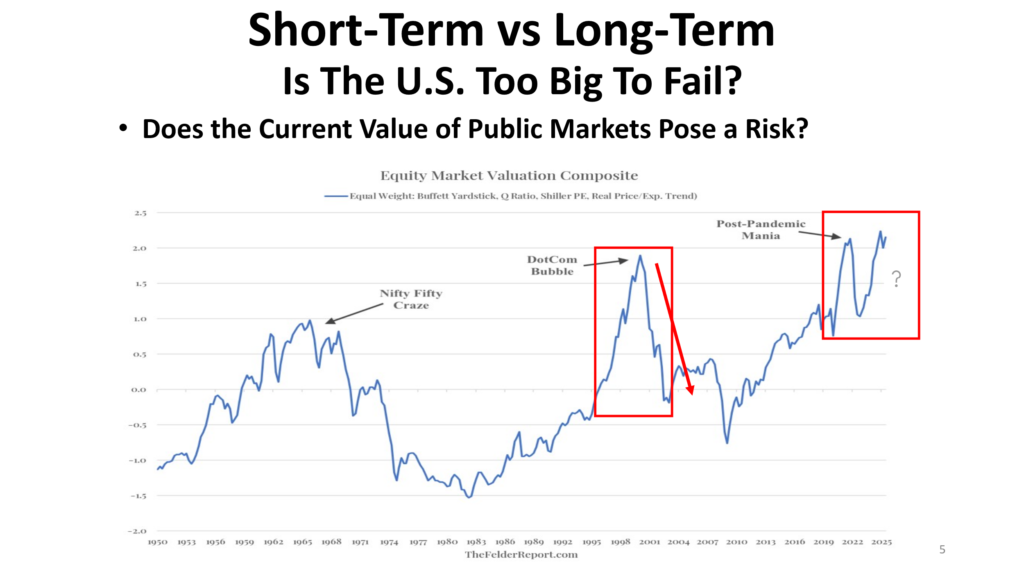
There are reasons that markets tend to correct when valuations become absurd.
When future expected returns turn negative, intelligent investors stop investing. When the market figures this out, the narrative changes from “risk-on” to “risk-off.” When this narrative shifts, the investing public realizes that the returns priced into current valuations offer little to no appreciation, so they sell and seek alternatives.
Are we at that level today, as the question mark asks? The short answer is yes.
As we mentioned last month, please remember, this is not a market call.
The world could stay at these levels or even move up from here, as we will discuss in a few minutes.
Why? When liquidity is plentiful and animal spirits are this high, momentum, along with recency bias, often fuels levels of speculation that don’t make much sense.
As you can see from the chart, current valuations are higher than those of similar bubbles over the past 60 years.
Matt: OK, we know valuations are higher than they should be. We know that historically, this has spelled trouble – or at least significantly lower returns over the following decade.
Slide 6
The question everyone wants answered is what will cause the market to become more fairly valued.
Will it be like a dam breaking and chaos ensuing, or will we simply enter a decade of high volatility with the market going nowhere until earnings catch up to current valuations?
Slide 7
Well, of course, no one knows.
However, there are several economic variables that offer hints at what the future might hold and what might become the straw that breaks the camel’s back.
As you might guess, it is liquidity. If the U.S. Federal Reserve stops injecting money into our U.S. economy, our economy is most likely to swiftly decline into a recession, the consequences of which we can’t estimate, due to the magnitude of our outstanding debt.
Here, you see a chart that clearly shows our U.S. GDP slowing, as indicated by the dark blue line, and inflation increasing, as indicated by the light blue line.
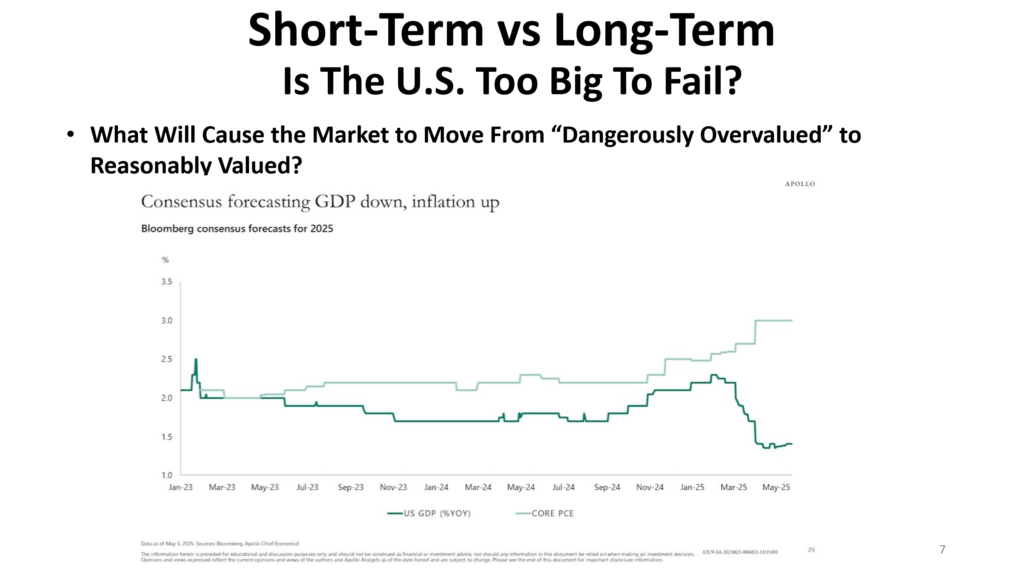
This often leads to stagflation, which is very uncomfortable for most people. Inflation is high, and wages fall behind the inflation rate as the economy stays sluggish and job opportunities are limited.
Of course, this could change; yet, through May and into June 2025, this is what our U.S. economy looks like.
For those of you who believe inflation has been conquered by the level of interest rates, take a look at this next slide.
Slide 8
This slide is from our longtime friend at Crestmont Research, based in Corvallis, Oregon, and run by Ed Easterling, one of the unsung heroes of data analysis and objectivity in my opinion.
This slide is somewhat busy, yet it contains a lot of important and potentially overlooked information.
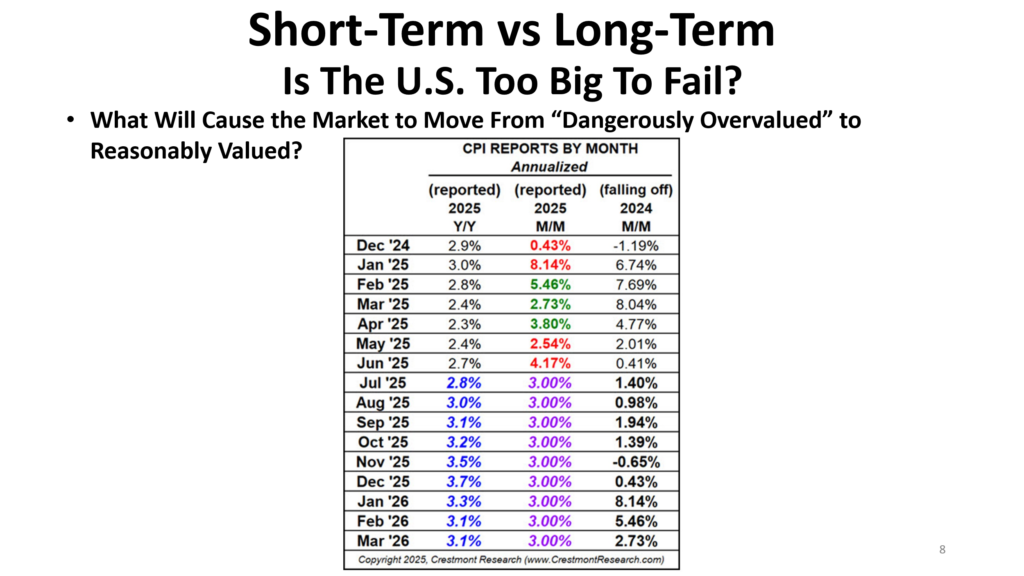
In summary, the information in this table suggests that we are likely to enter an environment of increased inflation over the next six months.
It’s hard to predict what will happen afterward, yet over the next 6 months, the very low, old inflation rates are dropping off. The older inflation rates are being replaced with higher numbers. These higher numbers are likely to influence a higher-than-expected inflation rate.
The chart shows the increases that are fixed through June 2025 in the middle column. All of the numbers after June are unknown; however, we do know some of the increases we are facing due to tariffs and supply chain challenges – those numbers are listed in the right-hand column. Each of the positive numbers in the right-hand column will add to our inflation rate.
We will send this chart to anyone who would like to review it for the details.
However, for the sake of this current discussion, inflation is more likely to increase over the next 6 months. If this is correct, it means that interest rate cuts are less likely, and if the U.S. Federal Reserve decides to reduce rates, the data suggest it will increase U.S. inflation.
This is a problem. Why? Because the market already has lower interest rates built into current prices, and unless we receive lower rates, current valuations are clearly too high.
Slide 9
Here are three slides that we discussed last month. I have included these three slides because they remain as relevant today as they were last month – or perhaps even more so.
This slide indicates that student loan debt has reached a level approaching $2 trillion.
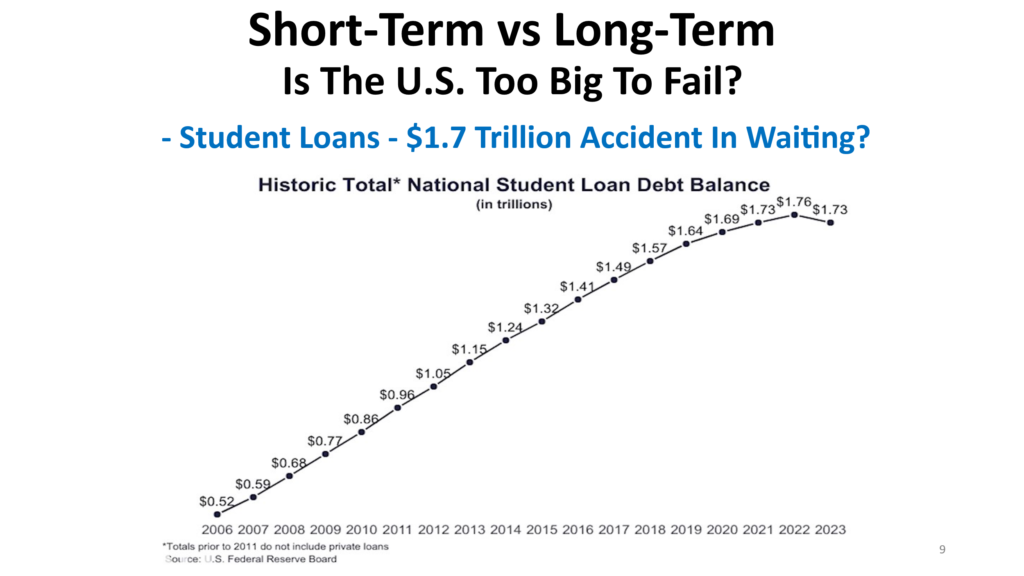
This creates a very risky asset class.
(For reference, many of you will remember the bad or fraudulent housing loans that caused the Great Financial Crisis in 2007-2009, totaling $1.6 trillion.)
Slide 10
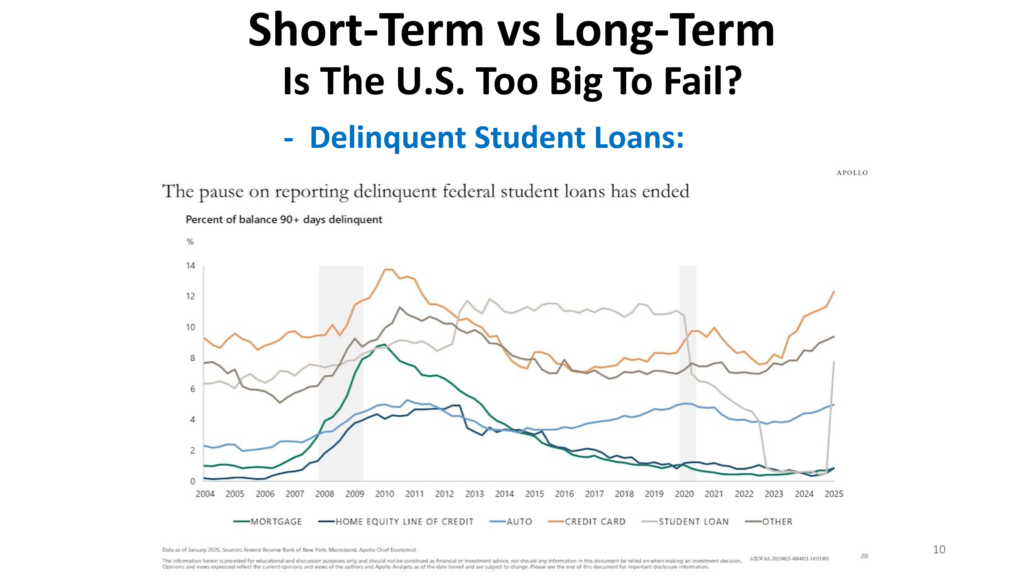
This slide compares the delinquencies of several asset classes with significant assets according to the asset class. While most categories of outstanding loan delinquencies are rising, the trajectory of student loans should create a level of serious concern for every investor.
Slide 11
This slide highlights the delinquency levels of student loans. Clearly, student loan delinquencies have increased at an alarming rate.
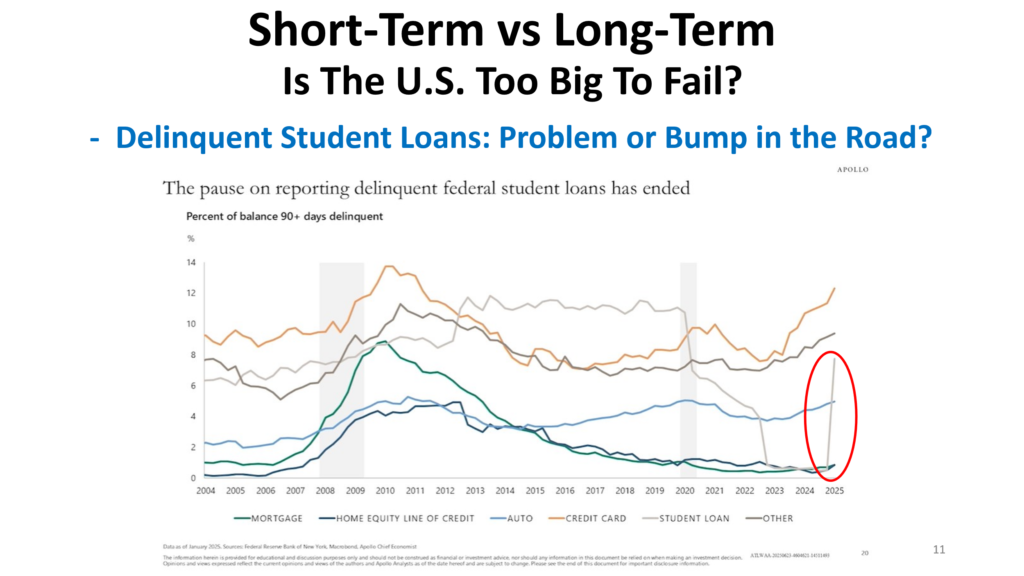
It does not suggest the end of the world, yet it could very well be an event similar to the real estate crisis that triggered our last severe downturn.
This is alarming because the Great Financial Crisis occurred with significantly less U.S. government debt outstanding. When categories of loans are large and prove to be bad loans, it often creates a hole in our economy, and could indeed trigger a crisis.
Slide 12
This slide highlights the concentration of the top 7 stocks in the S&P 500. As you are aware, they are at record levels.
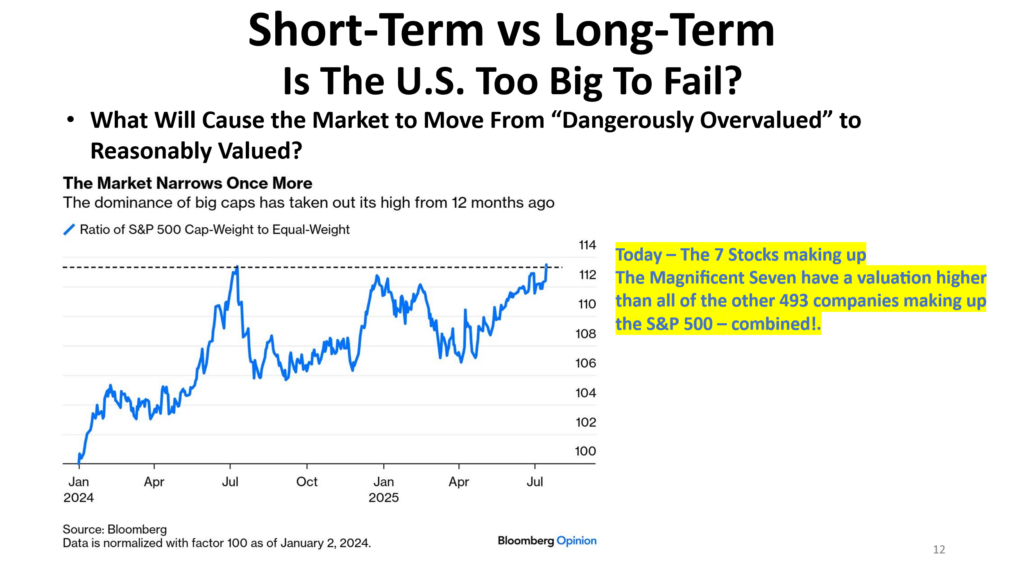
However, what you might not know is that the top seven S&P 500 companies today (the Magnificent Seven) are valued at more than the combined value of the other 493 members of the S&P 500.
This presents a significant risk. The Magnificent Seven are priced for perfection and are clearly delivering strong earnings. However, history is filled with examples, too many to mention, where highly valued companies created expectations that ultimately were not met. When reality caught up with current prices, the fall from grace was swift and devastating.
If the narrative around even a few of the top 7 names changes, the whole market will be affected. (And not in a good way.)
Slide 13
This slide is from a completely different source, and it clearly shows the same dynamic – incredible concentration in the current market.
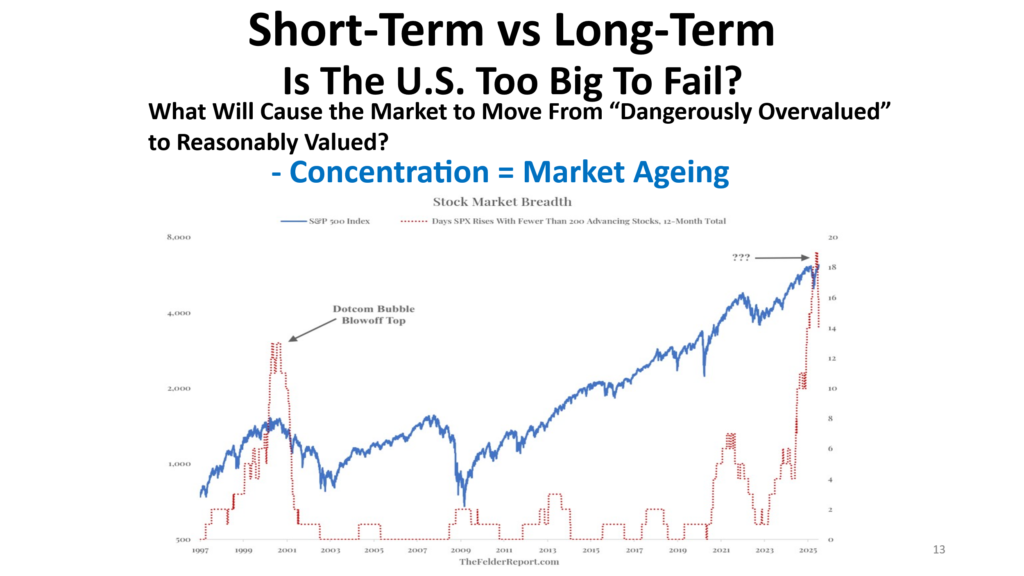
This chart shows a level of concentration that undoubtedly exceeds the dot-com bubble concentration, and I don’t have to remind many of us on this call how that ended.
However, I do want to make sure we are being fair and point out some differences between the dot-com bubble and the current Magnificent Seven bubble. The seven companies today, who are largely responsible for the overpriced market, are delivering solid earnings, and earnings are increasing at rates that justify a premium valuation. The dot-com bubble was based more on future expectations and less on current, high-quality earnings.
Slide 14
Our point? The expectations priced into today’s public stock market tells every intelligent investor that a significant amount of future earnings are already priced in.
What are current valuations telling us to expect for those invested in the market today?
Slide 15
This slide is one we have used before, and it comes from the excellent analyst John Hussman of Hussman Strategic Advisors.
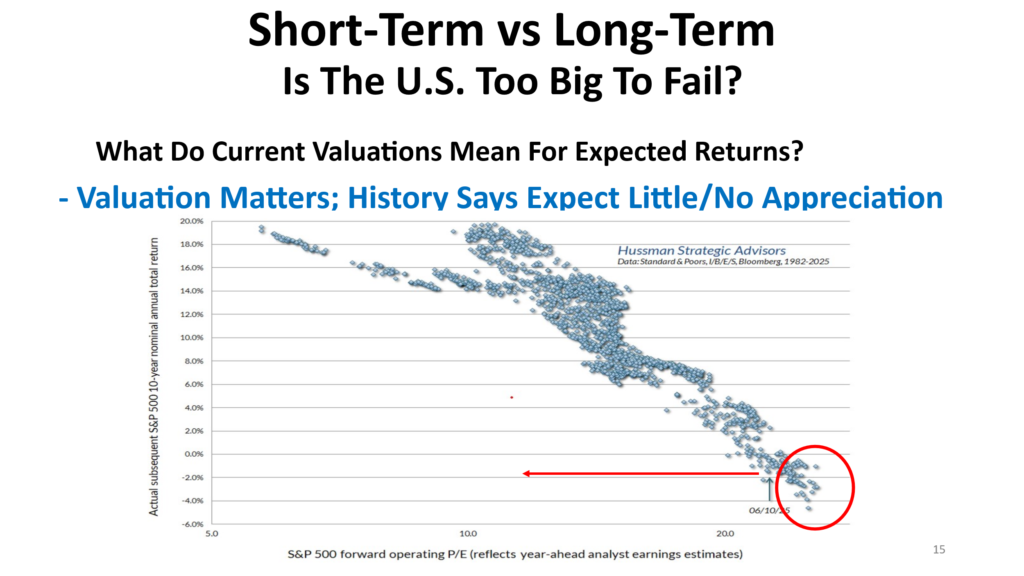
This slide plots the valuation given to the operating earnings of the S&P 500 which are expected (one year in advance), and then shows the outcome for investors 10 years later who were still investors.
This chart goes back to 1982, and if you believe history offers a reasonable view of the future, you will clearly see that current prices foretell investors will earn -2% over the next decade, based on today’s prices.
Here is a chart that employs different forecasting methods yet yields almost identical results.
Slide 16
The orange line indicates the prices paid for a certain level of earnings (commonly called the price-to-earnings ratio) and the green bars indicate the returns investors received 10 years hence.
This study goes back to 1909 (which is no easy task as historical data is difficult to come by; this study and the respective chart are again credited to Ed Easterling at Crestmont Research.)
What you will notice from this chart is the consistent mirror images of the orange line and the green bars. The takeaway? When you pay a foolish price for publicly traded assets, you should expect less return, or in some cases, negative returns.
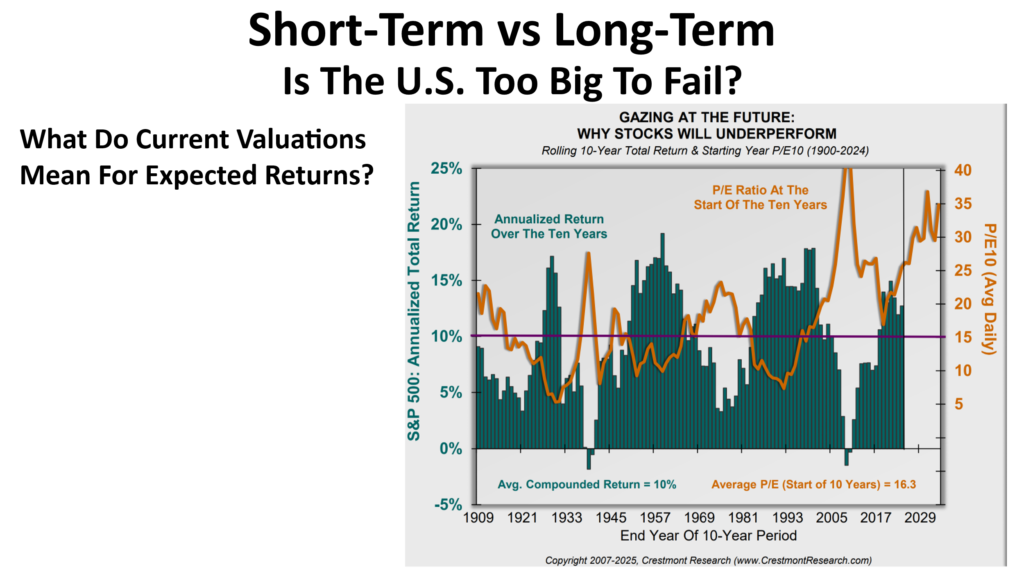
The following chart also clearly shows what John Hussman’s chart showed: investors today should have low expectations for the returns received over the next ten years.
Slide 17
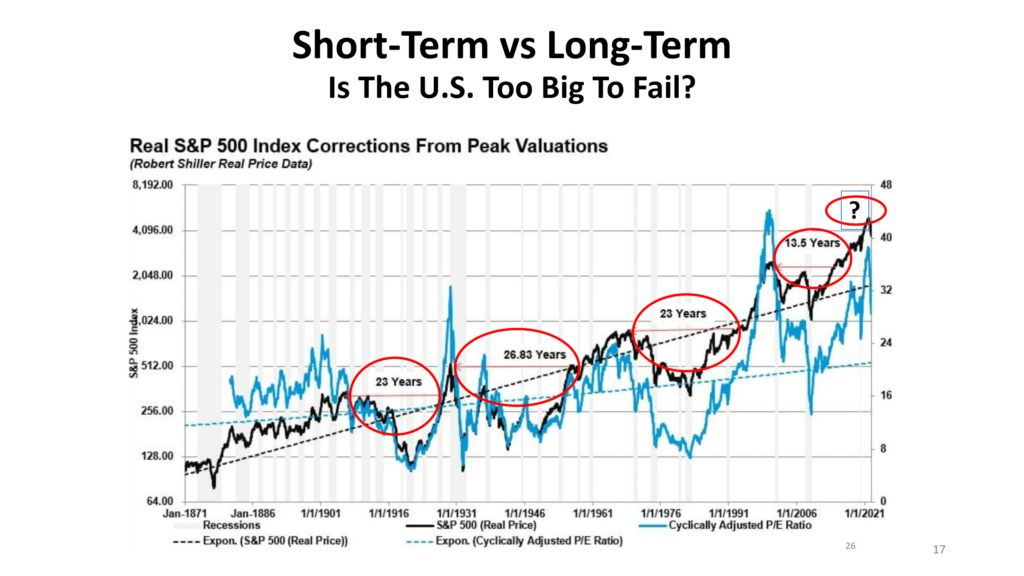
This is a slide we have referenced now for the better part of the last year. The reason we continue to use it and update it?
We believe the U.S. government will keep printing money. The U.S. government and the Federal Reserve will continue spending more than they have. This usually softens economic slumps but often causes unwanted inflation. History shows that endlessly printing money is not sustainable, yet the rest of the world seems to tolerate this foolishness.
(And to be frank, most of the world is participating in overspending and printing money just like the U.S.)
We believe the U.S. stock market could experience a decade or more of no returns (outside of inflation) for investors who are counting on the appreciation of their assets.
For those who don’t believe this could happen, you will be surprised to see from this chart that not only have there been lost decades, there have been markets spanning over 20 years with no appreciation, as you can clearly see. In fact, if you count the years of no investment returns outside of dividends, vs the years in which investors enjoyed appreciation, you will see that almost 40% of the time, investors endured lots of volatility with little to no reward.
The combination of current market pricing for perfection, along with the visual reminder that history is full of long periods where there is little or no appreciation, is the reason our Family Office has been strongly suggesting the focus on making sure any and every investment is paying dividends, or as we call it “publicly traded ‘rent’ for the use of our money/investment.”
Now, let’s move on to the most compelling and unnerving question I have encountered in some time.
The question is: “Is the U.S. too big to fail?”
While the question may evoke a yawn from many, the answer has far-reaching implications for investing strategies.
This was a question Matt brought up, and because he brought it up, I want to give him the first crack at creating a framework for a) answering the question; b) helping us understand what “yes” means to the investing public, and what “no” means to the world.
With that said, let me turn it over to Matt.
Slide 18
Matt: Thanks, Steven. This is a topic that has been danced around ever since I can remember. Analysts don’t want to go through the mental gymnastics to figure out the answer.
It seems too easy for us to continually spend more than we earn in revenue as a country. It looks like avoiding every economic downturn is as simple as injecting newly printed money into the U.S. economy.
We want to discuss something that has been on many people’s minds lately: with everything we know combined with the almost infinite number of future events that we clearly and admittedly don’t know, is the U.S. too big to fail?
Slide 19
If the U.S. is too big to fail, how should one invest? If the U.S. is not too big to fail, what should our strategy become?
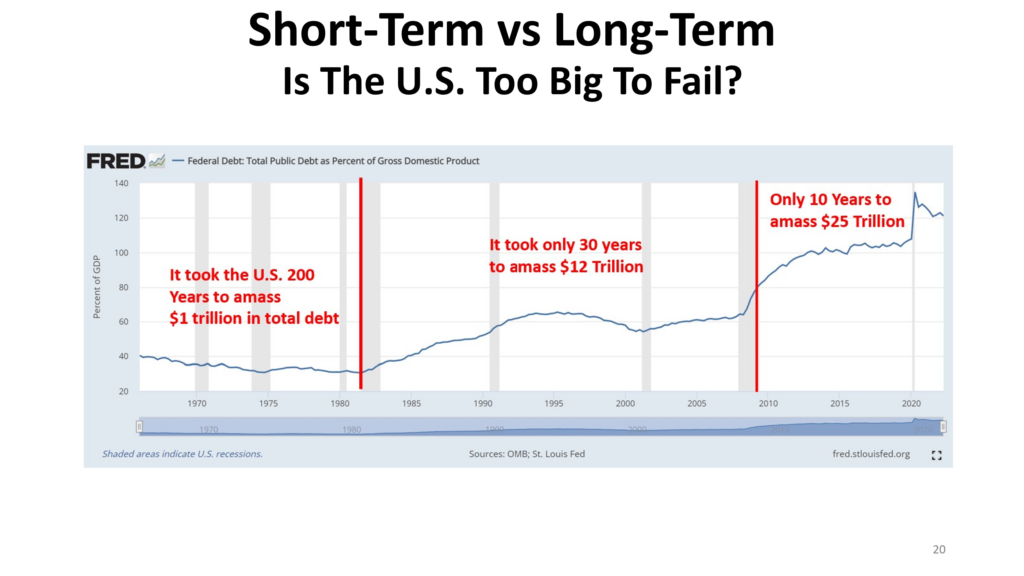
Slide 20
The prevailing narrative is that this debt is a house of cards ready to collapse, leading to a financial doomsday. This viewpoint, however, overlooks a critical factor: the sheer size and the interconnectedness of the U.S. economy within the global system. The U.S. isn’t just a country with a large economy; it is the linchpin of the modern financial world.
Think about it this way: U.S. Treasury bonds are the foundation of the global financial system. They are the benchmark for global interest rates. They are the primary reserve asset for central banks worldwide, and the ultimate safe haven in times of crisis. Major international institutions, foreign governments, and individual investors all hold vast amounts of U.S. debt.
So, what would happen if the U.S. were to default? Think about the consequences…
It wouldn’t be just a domestic issue. The trillions of dollars in assets owned by entities from the Bank of Japan to ordinary pension funds in Europe would either lose value or be completely wiped out. Global trade, mostly conducted in U.S. dollars, would stop. Financial markets would face chaos and destruction on a scale that would make the 2008 Great Financial Crisis seem minor.
My point is that the global economic consequences of a U.S. default are so devastating that the world would never allow it to happen. The incentives for everyone, from our biggest trading partners to our geopolitical rivals, are aligned to keep the U.S. solvent. The alternative is a worldwide depression that would devastate every nation on Earth.
Slide 21
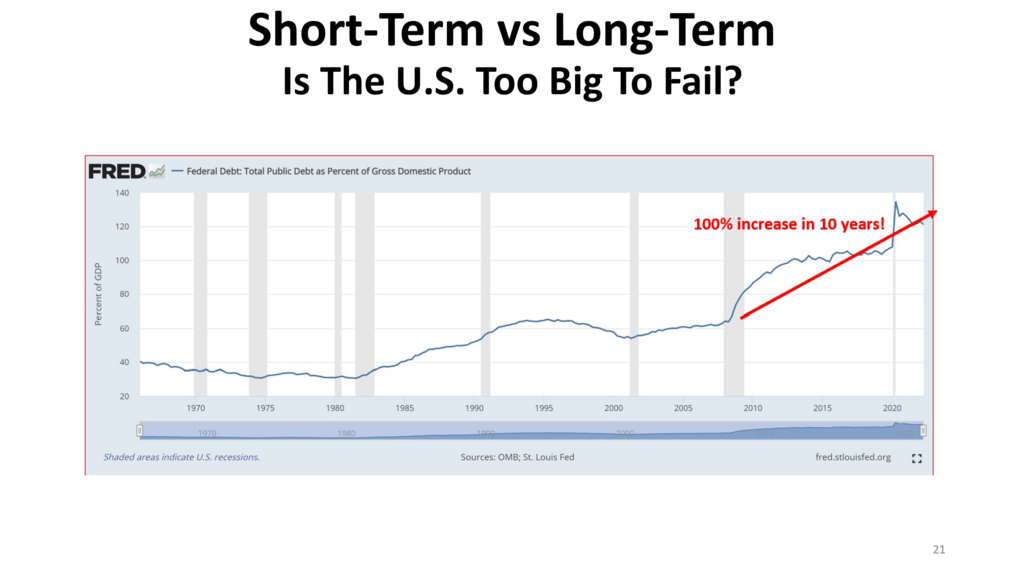
Ultimately, this does not argue for fiscal irresponsibility. We all agree our current overspending is unsustainable, and that aiming for a more sustainable path is essential. Still, self-survival logic offers a practical perspective on the realities of our globalized world. The U.S. is, in a very real sense, too big to fail.
The U.S. economy is a critical pillar of the global economy and vital for worldwide stability. While headlines may scream about default risk, the reality is that the shared self-interest of the worldwide community acts as a strong restraint, making a U.S. default a theoretical worst-case scenario rather than a likely one.
Thanks, Matt – and I would like us to continue this discussion on this very topic in one of the next “First Friday” discussions.
I think it may be a good idea to discuss some of the topics that are contributing to the stock and bond markets remaining overvalued, and which may be the reason the markets continue to chart new highs seemingly each week.
Slide 22
The U.S. administration continues to spend more than it earns. We continue to inject money into our economy, despite its relatively good shape. And the amount we are injecting into our economy is stunning.
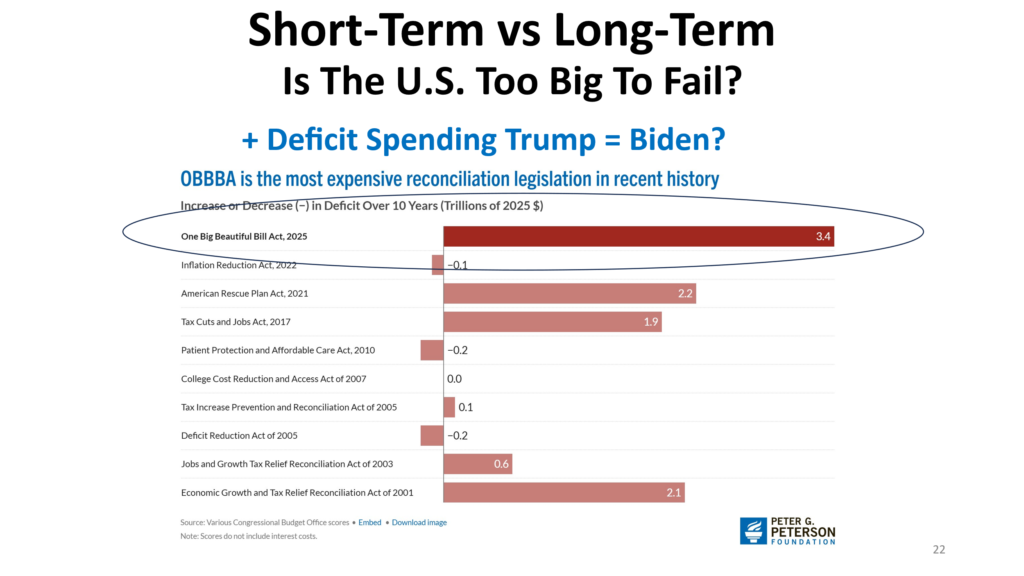
As said, the money printing numbers are staggering—trillions of dollars—and it’s easy to get caught up in the fear that this is a ticking time bomb. But today, I want to offer a different perspective, a theory that suggests this ‘risk’ isn’t what it appears to be.
This slide reminds us that the Big Beautiful Bill is going to inject $6.5-$7 trillion into our U.S. economy, despite the fact that we currently earn $4.5-$5 trillion as an economy.
Our contention is that in one way or another, the extra $2 trillion will eventually find its way into the public markets, thus creating a level of stimulus only seen during wars and pandemics.
Slide 23
Here is a slide from the U.S. Federal Reserve that shows the amount of money that has already been printed and is currently on the sidelines, waiting to be invested. Note: It is true that we don’t know the reason behind an investor’s motive for investing in a money market fund, many of which earn little or next to nothing. However, it is as likely as not that this money would become available for investment if an opportunity became available within the risk tolerance of the money market investor. In short, our belief is that at some point, this pool of assets ($7 trillion or more) would be available for investment… and this is a significant pool of investments.
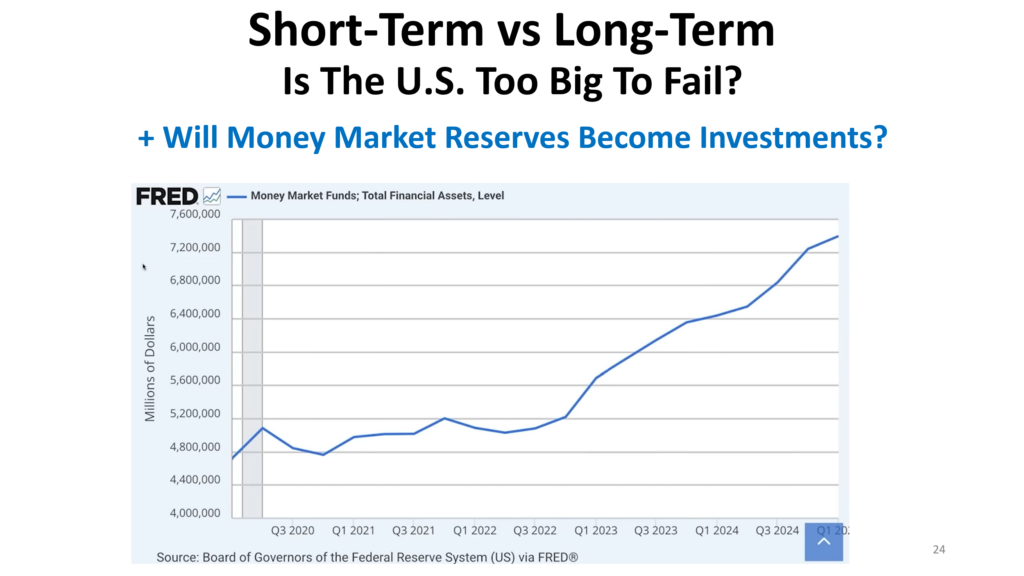
This slide indicates that a strong and substantial amount of liquidity still exists for the investing public, supporting the consistent refrain of “buy-the-dip” heard from talking heads on TV.
So, given what we know today, the U.S. is likely too big to fail. The reasoning is that the rest of the world is so dependent on the U.S. economy and the U.S. financial system that a U.S. default would cause as much, if not more, harm to the rest of the world than to the U.S. This logic seems to imply that the rest of the world can’t let the U.S. fail.1
If this reasoning is correct, it suggests that savvy investors should remain invested in high-quality, value-oriented U.S. public companies. They should also hold a substantial amount of liquidity in high-quality U.S. and corporate debt, which will enable them to leverage the inevitable revaluation (a nice way to describe a massive market sell-off) at some point in the future.
The fact that the U.S. remains addicted to its printing presses, which allow it to inject trillions of dollars per year into an economy (that would be in recession if not for the deficit spending), seems to be a victory unworthy of a celebration.
There should be no question that this level of spending—typically seen during recessions and wars—will continue to fuel speculation and overvalued public markets.
We want to thank each of you for attending this webinar, and we want to encourage your questions, as we struggle to make sense of a world where overspending is the norm and “Alice In Wonderland”-like reasoning becomes sustainable logic.
1 While the stated logic is undeniable, it is too hard for us to believe this is true. We believe that the U.S. can fail or at some point will have to devalue its dollar – as has been happening for the better part of the year so far. So as logic would state the U.S. is too big to fail because it would hurt the rest of the world as much or more than it would hurt the U.S., our belief is that our U.S. dollar will depreciate relative to the rest of the world’s dollars, and this gradual default is our medicine for a global hegemony with an addiction to money printing.