
Footnotes will be a monthly publication which follows our “First Friday” webinar presentations each month. The goal of the Footnotes publication is to summarize our “First Friday” presentation’s most important data points, which will make it easier for The Abernathy Group Family Office members to make intelligent decisions based on facts and data – as opposed to potentially conflicted opinions – from the mainstream media.
Click here to view the corresponding First Friday Video
Commentary from the December “First-Friday” meeting:
In December’s “First Friday” investor meeting we are going to discuss the prospect of investing during periods of uncertainty. We will discuss one intelligent pathway forward when the future offers several different outcomes and at times diametrically opposed outcomes.
As a short reminder to each Family Office member, The Abernathy Group Family Office has now had 12+ “First Friday” webinars. All of them are available on our website and “YouTube” Channel if you would like to go back and see how we have interpreted the economic signals, while doing our best to cancel the noise over the last year plus. Our goal: to help our Family Office members save time and make intelligent decisions by ignoring information with little predictive power and focusing on data with the highest probability of telling us what is to come.
If you will remember, we started these “First Friday” meetings in October 2022, because we saw storm clouds on the horizon.
The U.S. Federal Reserve was fighting a bought of inflation which turned out to be stickier than originally thought by increasing interest rates and decreasing the liquidity in our economy.
History tells us there is an 80% probability of the Fed over-tightening, and eventually sending us into a recession.
While recessions are events intelligent investors would like to avoid, current conditions have heightened our concerns. Here is why: Our U.S. debt has increased by over 30 trillion over the last 40 years. That’s 30X the debt it took our country over 200 years to amass, and most of it accumulated in the last 15 years.
History shows that debt magnifies economic outcomes, both good and bad. Since the probabilities of a severe recession have increased, we thought it would be intelligent to discuss the increasing possibility economic headwinds impose on investors, especially when the capital markets remain overvalued, and speculation is abundant.
This confluence of negative signals based on economic data gave us concern. Our goal was to call your attention to the data separating the signals from the noise and to prepare all of our families for what lies before us. In short, this is the reason behind starting these webinars.
In 2022, the U.S. Federal Reserve began draining liquidity from the U.S. economy. Over history, this action overwhelmingly leads to a recession. We expect no other outcome this time.
The data tell us the U.S. will enter a recession in the first half of 2024 or sooner.
Make note: Recessions do not have to be significantly negative. Yet recessions tend to have similarities. Job losses reduced economic activity and economic output tend to rear their ugly head during recessions in unison.
Of primary importance to the investing public, recessionary periods reduce corporate earnings by an average of approximately 20%. When earnings decline, asset prices decline.
Since our publicly traded asset prices were already 2 standard deviations above normal, we thought it would be valuable to ensure all of the families we serve were well aware of the potential for negative outcomes, mixed with record debt levels to magnify risks ahead.
___
In the last 15 “First Friday” meetings, we have focused on the U.S. Federal Reserve’s intention to overcome inflation by reducing available money in our economy. In 11 of the last 14 inflation wars, the Fed sent our economy into a recession. The problem? During the last difficult bought of inflation, we had less than $1 trillion in U.S. debt. Today we have well-over $30 trillion in debt. The risks today are incredibly high.
We have also repeatedly discussed the fact that all 3 of the most important leading indicators show our economy is slowing. The odds are high – our economy will enter a recession over the next year – or sooner.
Today we are going to discuss what the data suggest will take place over the next 12 months and the strategies we believe will allow investors to avoid most of the risks and uncertainties, which are likely to confront us all over the next year, while still participating in a global market which is structurally sound over the long-term.
Before we start let’s discuss the elephants in the room:
Over the next few years, the U.S. economy – and the world – will have to come to grips with some especially critical issues. And while I am NOT trying to be melodramatic, if not solved, these issues could – truly – change the world as we know it today.
Two of the issues staring us right in the face are:
Slide 2
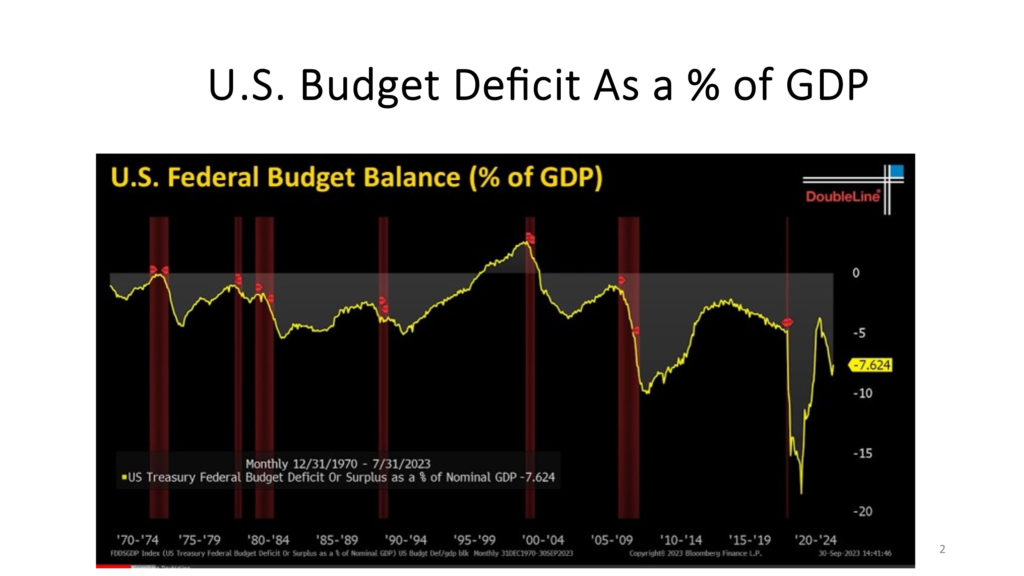
- Our economy. Here are the data which document the U.S. spending for more than 50 years.
The yellow line under “0” represents deficit spending. The yellow line over “0” represent the Clinton Presidency, our only surplus GDP in over 50 years –
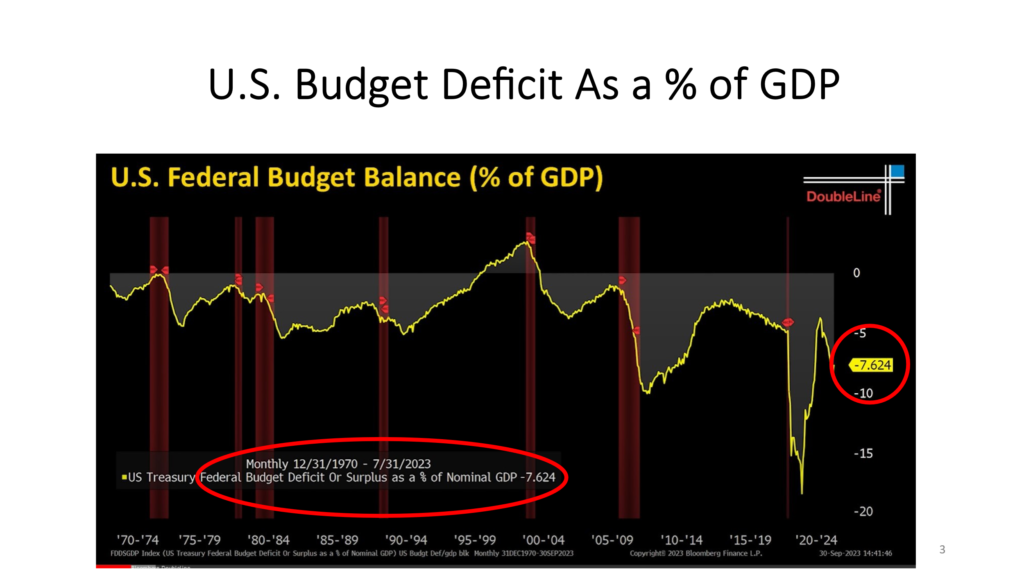
Slide 3
This slide simply highlights the magnitude of the recent deficit spending totaling – nearly – $2 trillion in 2023. *In one year!
Slide 4
This slide clearly shows it took us 200 years to amas our first trillion in overspending.
And similar to a drug addict, our politicians couldn’t get enough of the money drug.
They increased our debt by 12 trillion over the next 20 years, then over the last 15 years they doubled our debt by another 12 trillion.

The U.S. spending is unsustainable.
Our debt levels are unsustainable. You might ask why? The interest on our debt alone is approaching $1 trillion dollars per year. We are borrowing money just to pay the interest on our debt each year. Think about that for a moment.
As said, this is definitionally unsustainable.
And to make matters worse, we have no plan to stop our spending.
Make no mistake. There is no free lunch.
Correcting these overspending parallels a medical doctor’s dilemma when advising a drug addicted patient.
You must cure your addiction, or you will die –
Curing the U.S. addiction to overspending will involve change, and most of this change will be incredibly uncomfortable for the citizens of the U.S.
Slide 5
This slide shows inflation at roughly 4% today.
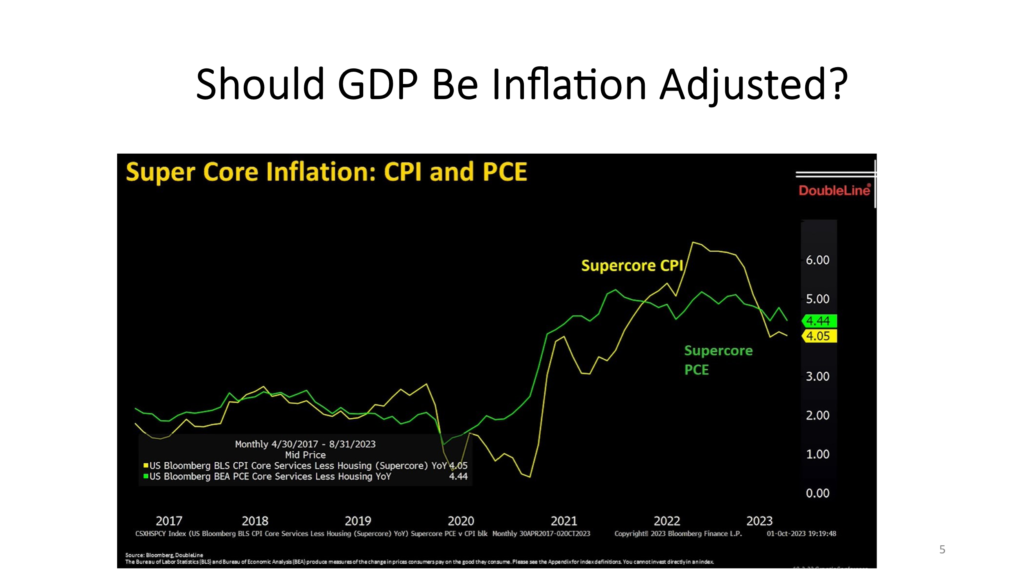
While it is quite likely that inflation will continue to move lower, it is as likely as not – that it may take longer than the market expects to achieve the 2% goal. Here is one plausible reason:
The world is becoming bifurcated into an eastern leaning alliance and a western leaning alliance. This is forcing a restructuring of supply chains for critical goods and services for almost every country on earth.
It means either finding new, friendly sources – formerly produced by low- cost producers, by the way – which took the U.S. almost 40 years to establish and refine, or it means producing it at home.
Either solution means higher costs for goods and services, so each of us should be aware: higher costs are likely for almost everything in our future.
Understanding there are more risks than we have time to discuss today, AND that most of the risks will not come true, lets discuss allocating a portfolio with what we Know.
Here is what we know:
Slide 6
We would like to share our base-case expectations for the next year or two, and how we have prepared our portfolios for the level of uncertainty in front of us.
Here is how we attacked this challenge.
Slide 7
First – let’s list what we know – or at least what we think we know to be true.
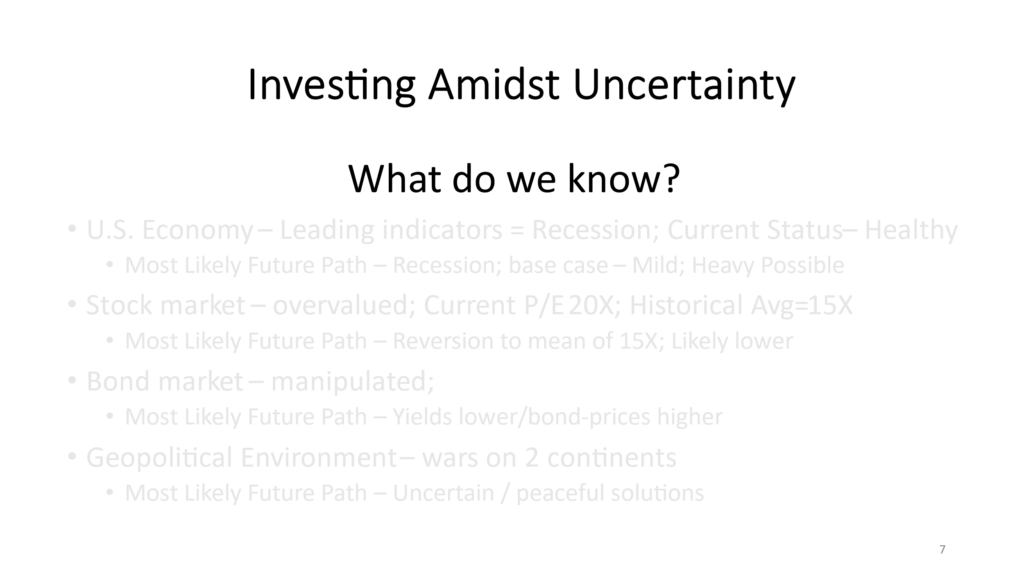
Next – our approach is to start with the top down – it is called the macro-economic approach.
We create what we call a “base-case” or what we call the most likely or highest probability case for each portion of our investment allocation based on what we know.
Slide 8
Here is our current thinking.
First – we want to understand our economy’s current state:
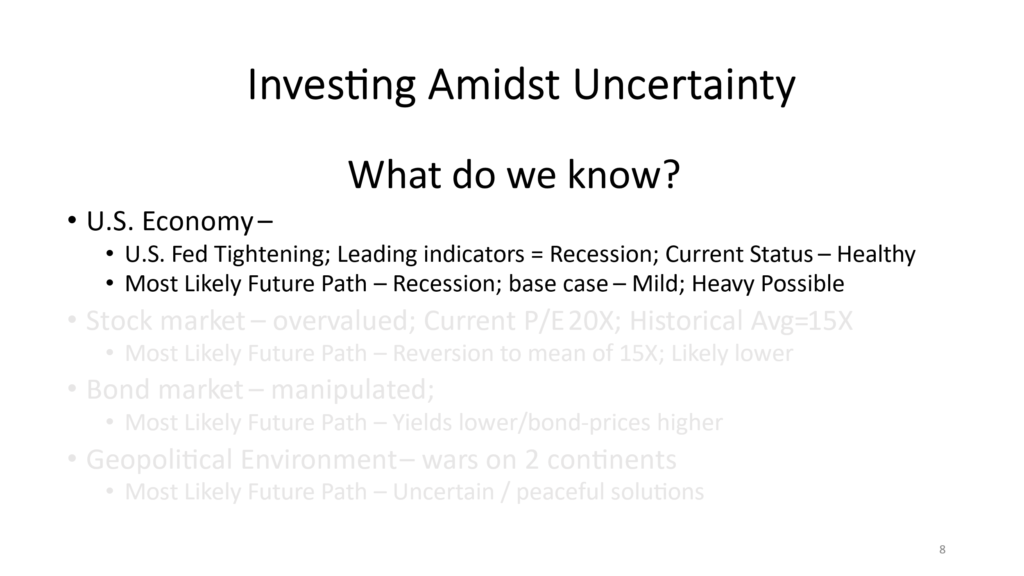
- U.S. Fed Tightening: Leading indicators point to a Recession; YET – the Current Status is Healthy
- Most Likely Future Path – Recession; base case – Mild; Hard Landing Heavy Recession is Possible due to the domino effects of our current debt.
Slide 9
Next: we look at the capital markets – we include both stocks and bonds:
- What is the stock market telling us? The stock market is clearly overvalued; Current P/E 20X; Historical Avg=15 X earnings.
- Most Likely Future Path – Reversion to mean of 15 X earnings; However, most corrections overshoot fair value before returning to fair value – and that is the difficult holding period for most investors.
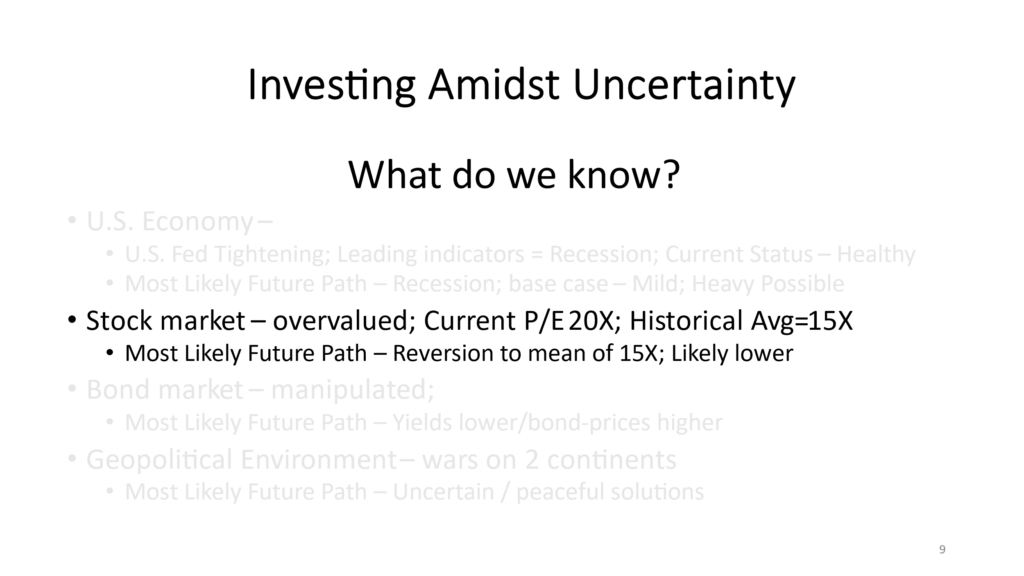
This likely means before the stock market starts to grow again, either valuations will have to decline by 20-40% or earnings will have to grow by 20-40%.
This could become a reality if the stock market corrects itself by lowering valuations by 20-40%, or we could “tread water” at current valuations for the next few years while corporate America becomes more profitable, and earnings increase by 20-40%.
History has shown that both realities are probable, as history is littered with corrections of 20-50% or more, and with periods of 5-10 years where the increased volatility of the stock market’s ups and downs ended in 0% appreciation. We would like to avoid both outcomes.
Slide 10
- Next, we look at the bond market. Of course, the bond market is largely manipulated by the U.S. Federal Reserve which means we are guessing at what the U.S. Federal Reserve will do next.
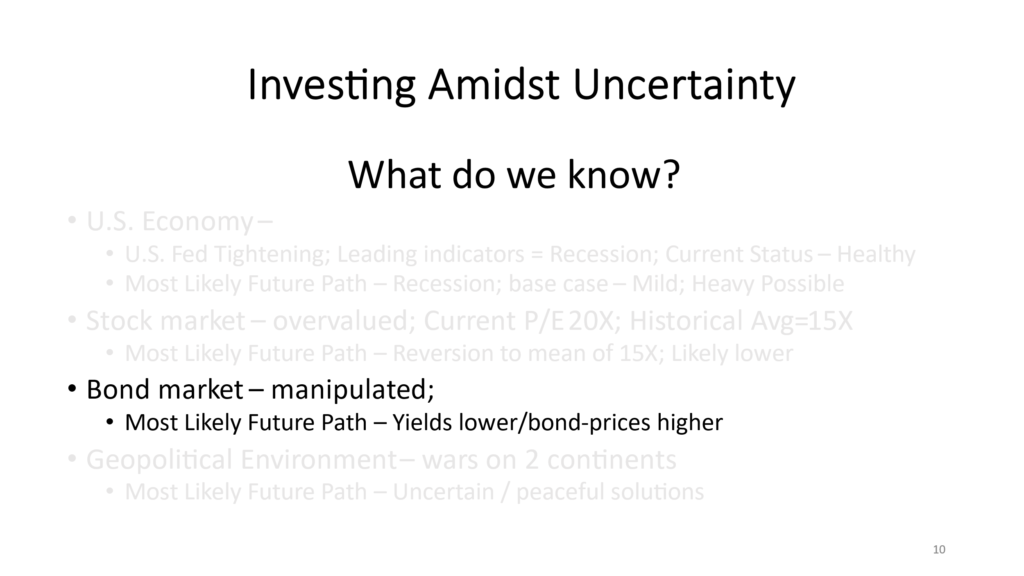
Our view is that the most likely future path for bond yields is lower – which means bond prices will be higher.
The reasoning is that we believe our inflation will slowly recede. This will give the Fed the ability to lower rates in an attempt to keep our economy out of recession.
If we are wrong and the inflation rate does not recede, the current interest rate levels will likely send our economy into a recession or something in our economy will break – which will force our U.S. Federal Reserve to lower rates in an attempt to rescue our economy.
Either way, we believe the Fed will lower rates at some point in the future, which means bonds are likely to be more valuable than the market currently believes.
Slide 11
The global macroeconomic environment today is likely to play a more significant role in our investment allocation than at any time since the 1980s cold war.
Today – we have wars on 2 continents. We believe the most likely future path is for peaceful solutions, yet we are a bit biased. This is truly a wild card and calls for a less assertive more conservative investment allocation.
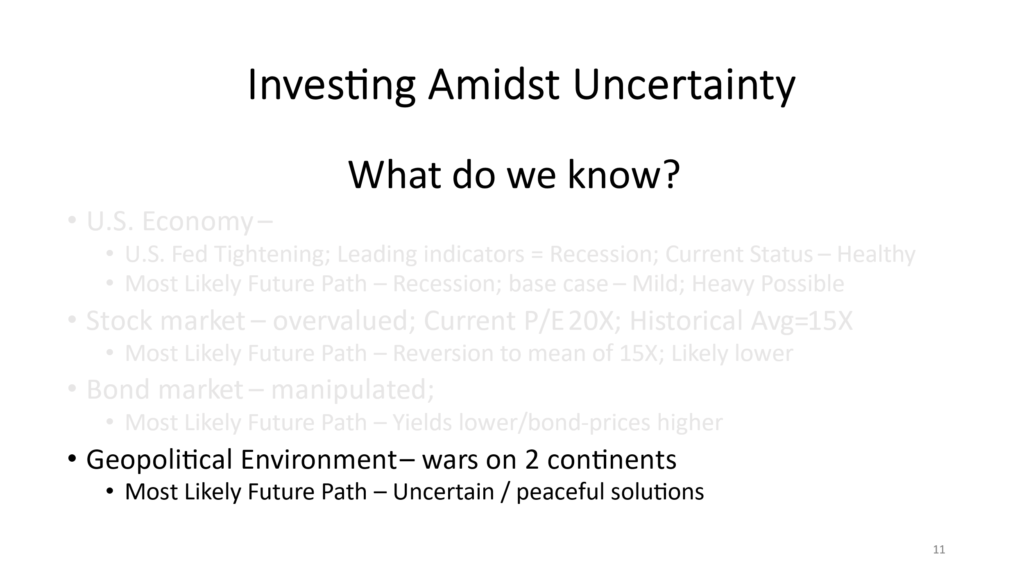
Slide 12
So – what do we believe we know?
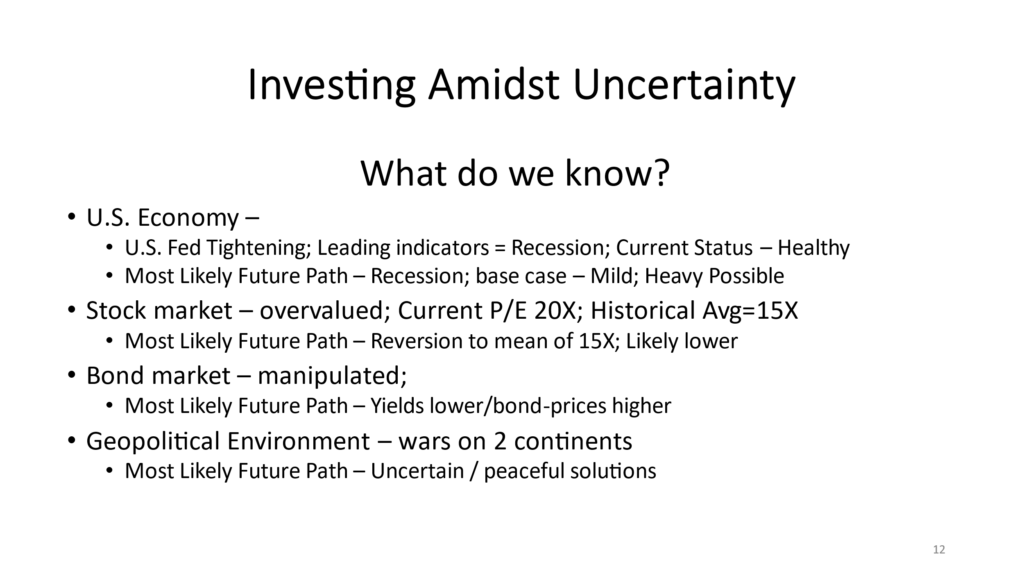
The stock market is overvalued. The U.S. Federal Reserve is trying to slow our economy, and they will be successful which will likely lower stock valuations more than normal. Our bond market is offering yields which are reasonably attractive relative to inflation. And the geopolitical environment offers a higher level of uncertainty than normal, which also suggests a more conservative investment allocation.
Next what do we NEED to know before we determine the investment allocation most likely to achieve a family’s goals.
Slide 13
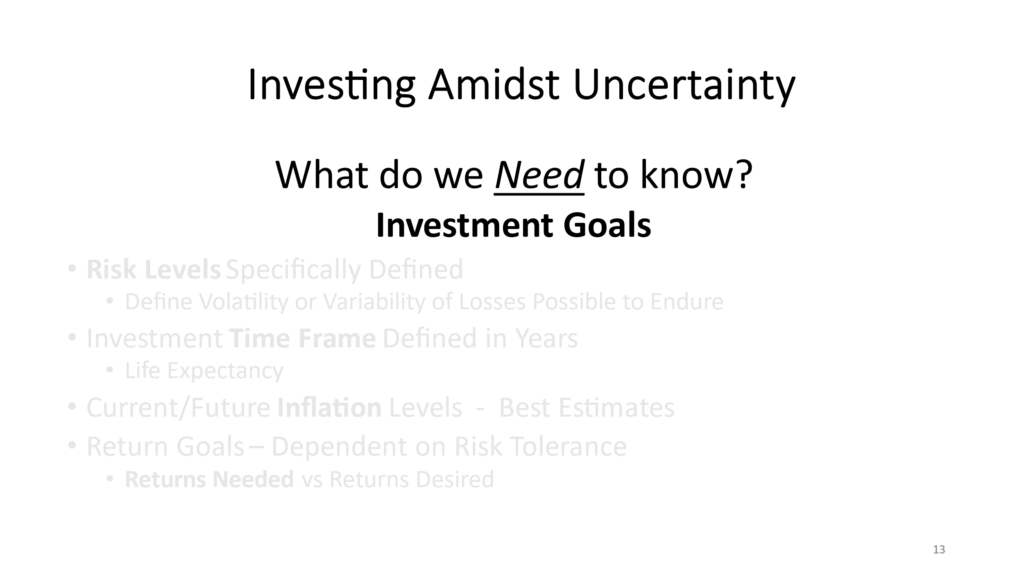
We first need to know the goals of the family or the foundation in charge of investing the assets.
How much risk is your family truly willing to take to invest in a stock market at currently overvalued levels? When investing at current valuation levels, history has clearly demonstrated that the next 5-7 years has yielded negative returns or no returns. Is the family interested in risking a sizable portion of their wealth when they can achieve a 5.3% return with no risk in U.S. Treasury bills?
Slide 14
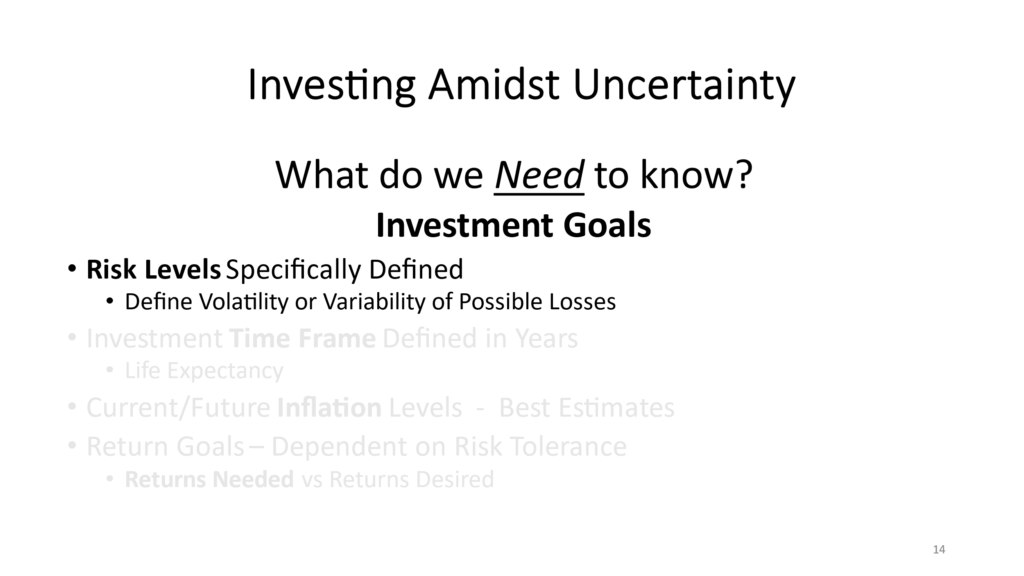
So, as said, the first step is to define your specific Risk Levels. Determine how much you are prepared to lose if history rhymes with the future.
Slide 15
Next – Define the time you plan to invest before you might need access to your investment capital. Reason: the longer your time frame the higher the probability of investment success. If the capital you are working with is primarily life-long investment capital and if it is supplemented by an adequate amount of capital elsewhere to support your family’s lifestyle demands, your investment time frame is likely to become your life’s expectancy.

Slide 16
Next – don’t forget to take a few minutes and include inflation expectations in determining the amount of capital needed to continue your current lifestyle. A reasonable inflation expectation is approximately 3% per year.
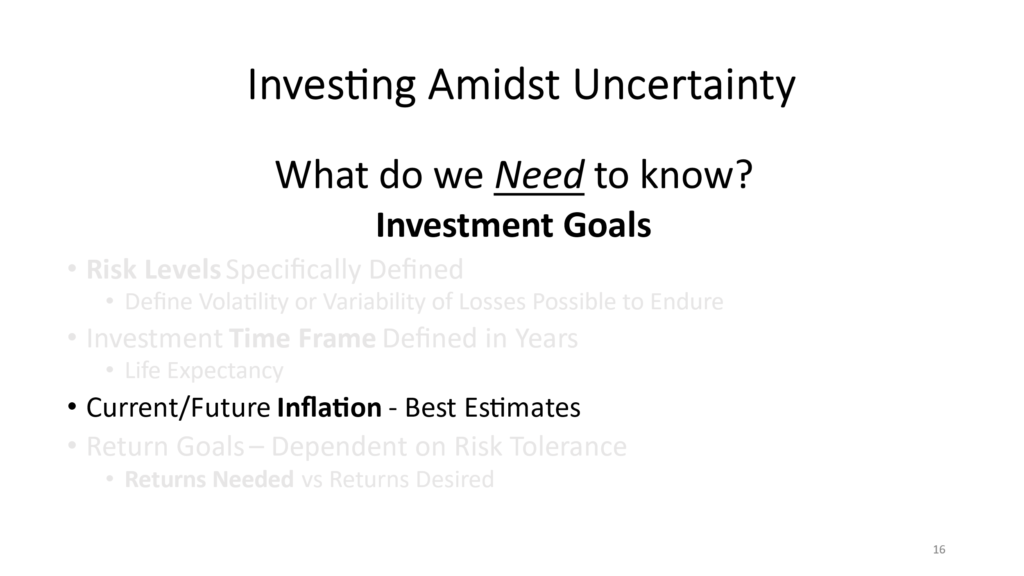
Inflation is our next hurdle. What we need is the current and future Inflation Levels. Your best estimates are a good start.
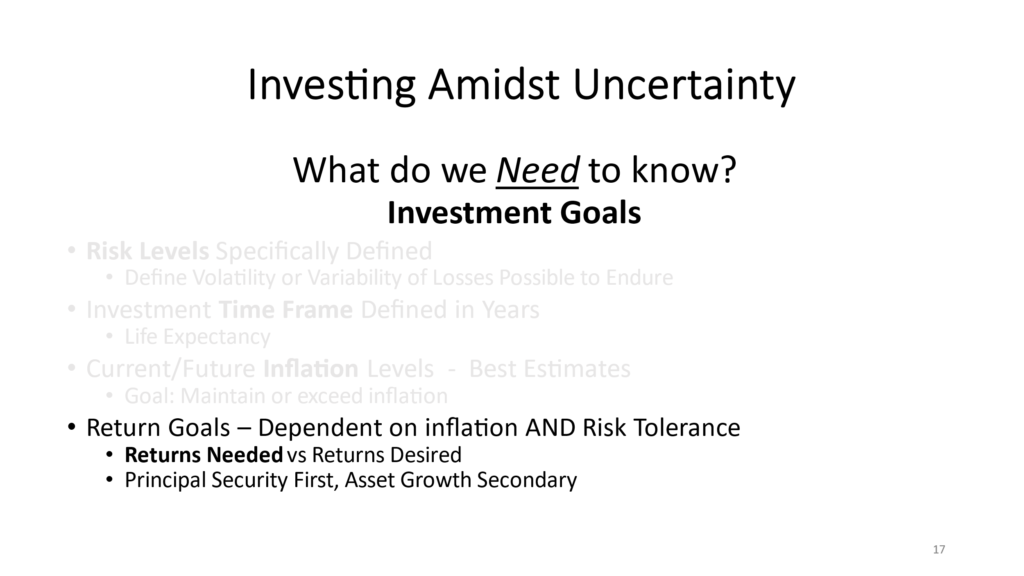
Slide 17
Return Goals – Your return goals are a combination of your risk tolerance, and your lifestyle demands. It is particularly important to determine and understand the difference between the returns which are required to support your family’s lifestyle vs returns desired. The required returns are based on your lifestyle and your asset levels, and often have little to do with your desired returns.
Slide 18
The information on Slide 18 offers reasonably stable asset categories offering lower risk levels and current income. It is incredibly important to diversify your asset categories, risk levels, and reliance upon asset appreciation and income generation.
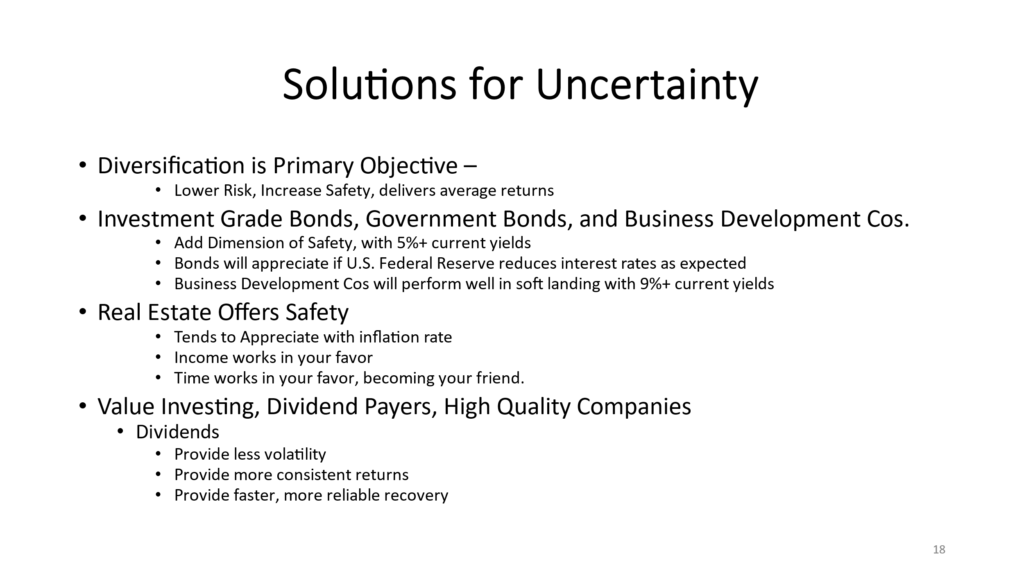
Asset categories which pay dividends tend to be higher quality than those that pay no dividends, and the fact that they can, and do pay dividends, may mean their profit levels and balance sheet are both in excellent shape and growing.
As you may know and understand – all bonds are legal contracts and are senior to equity holdings. There is little appreciation in the debt market unless you are able to invest below par value.
Real estate tends to offer dual methods of compensation for intelligent investors. Over time appreciation tends to increase in value with inflation, while the income generation provides current income and decreases your capital outlay.
If you are going to invest in the equity markets, we strongly suggest focusing on companies categorized as high quality, dividend paying value-based companies as it may reduce your risk of overpayment for an asset and often provides less volatility with frequent dividend increases which at times will keep up with or exceed inflation along with potential appreciation.
Slide 19
This chart clearly shows the amount of investment return provided by dividends.
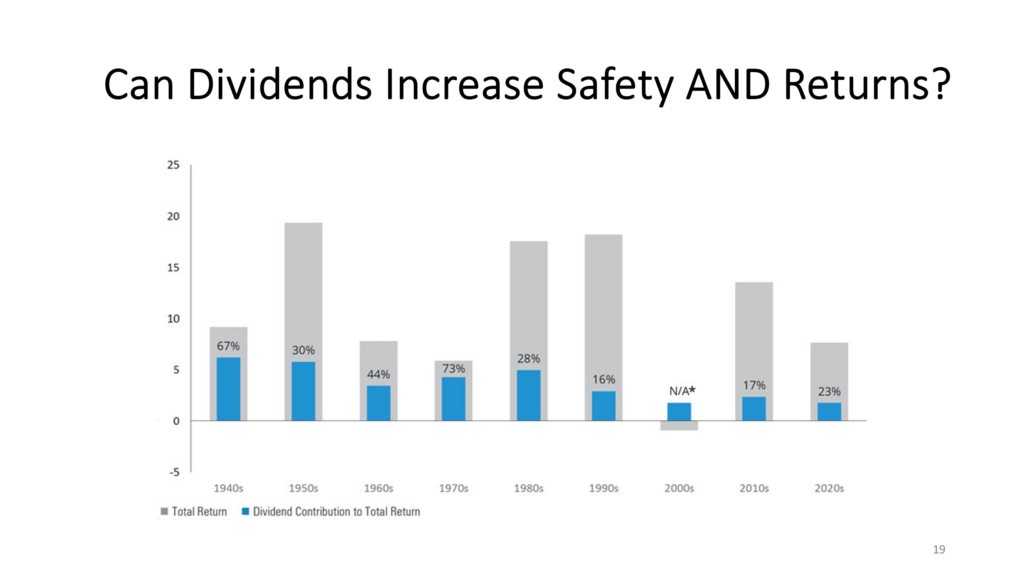
Another way to look at this chart is to remove the amount of return in blue and determine the total return without dividends. Either way, I believe you will see the reasons Warren Buffett has stuck to companies which pay dividends as his core philosophy for the last 50+ years.
Investing in companies which pay dividends, as said, provides 2 pathways to superior risk adjusted returns. Dividends and asset appreciation will both work for you when the appropriate investments are made.
The dividend is never guaranteed, yet most intelligent investments in companies with a long history of dividend payment are made with the understanding that the corporate Board is loath to reduce dividend payments. For the most part, dividends tend to increase at or ahead of the rate of inflation over time.
As dividends increase, so does the price of the company. As you can see the amount of dividends paid as a percentage of the total return tends to fluctuate.
Slide 20
This chart allows for dividends to be reinvested in the dividend-payers stock –
The returns in blue represent the total returns dividend investors received from 1960 through 2022.
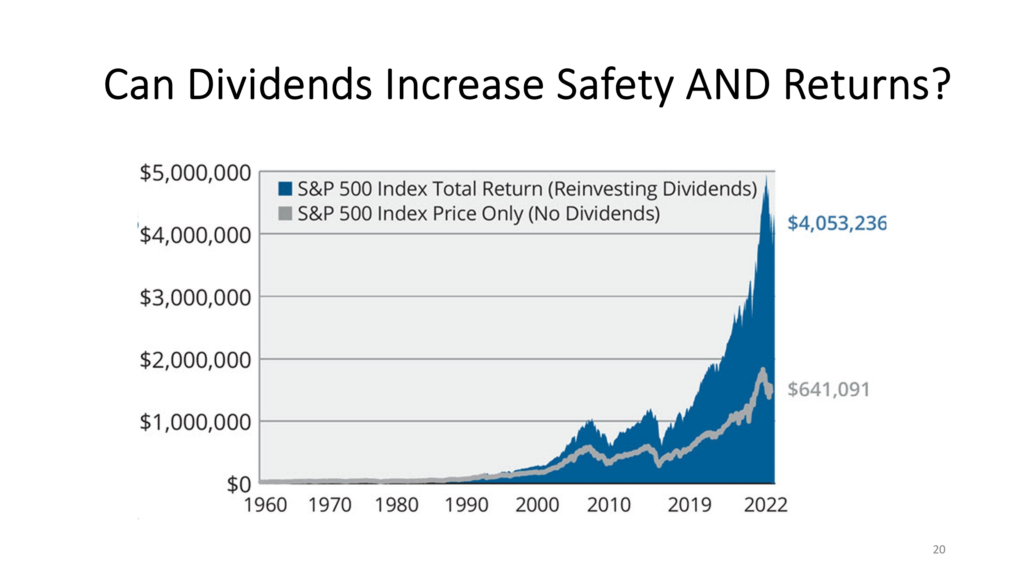
The line in gray represents the total return investors received if they did not collect their dividends and reinvest it in their company stock.
The bottom line is that dividends provide regular income, categorize companies that can actually pay dividends as high-quality companies, and provide completely passive income – meaning the investor has no work involved with receiving dividends. Dividend paying companies tend to depreciate less than non-dividend paying companies during downturns, and most tend to appreciate faster than the non-dividend payers when markets turn up. And most importantly, dividend paying companies tend to increase their dividends faster than inflation, so inflation allows your asset values to remain relevant.