
Footnotes will be a monthly publication which follows our “First Friday” webinar presentations each month. The goal of the Footnotes publication is to summarize our “First Friday” presentation’s most important data points, which will make it easier for The Abernathy Group Family Office members to make intelligent decisions based on facts and data – as opposed to potentially conflicted opinions – from the mainstream media.
Click here to view the corresponding First Friday Video
Commentary from the March “First-Friday” meeting:
March’s “First Friday” meeting focused on the important investment themes for intelligent investors during 2024. Here are the “Footnotes” from this meeting.
As a short reminder to each Family Office member, The Abernathy Group Family Office has now had 12+ “First Friday” webinars. All of them are available on our website and “YouTube” Channel if you would like to go back and see how we have interpreted the economic signals, while doing our best to cancel the noise over the last year plus. Our goal: to help our Family Office members save time and make intelligent decisions by ignoring information with little predictive power and focusing on data with the highest probability of telling us what is to come.
Today we are going to discuss the 3 themes we believe have a better than 50% chance of influencing our capital markets during 2024.
You might ask – why this is important?
In a market environment with abundant uncertainty, it is important to be prepared for any number of shifting environments. And with current U.S. and global debt levels, at some point, the shifting environments will be more disruptive and surprising.
Our longstanding thesis still remains – “You can’t predict; you can prepare.”
This is an important thesis, and each The Abernathy Group Family Office member must understand the uncertainty associated with the future.
Predicting the weather a month ahead of time is difficult if not impossible. The seasonal weather patterns based on historical data are typically about the best we can do with weather prediction. And during those seasonal predictions there are often surprising weather events, yet the weather typically returns to its average seasonal expectation over time.
The stock and bond markets are similarly difficult to predict as we do not have seasonal frameworks with centuries of history to reference. The best we can do is to substitute valuation for the seasonal patterns; avoiding overpriced markets seems to correlate well with winter and hostile investment performance, while underpriced markets tend to correlate with spring and summer and often yield intelligent investment activity.
An investor’s minimum goal must be to ensure an awareness of the data, and what history tells us about the range of outcomes we should be expecting under similar circumstances.
Many of the themes discussed today are evolving as a natural consequence of capitalism and human progress. Some themes will have incredibly positive effects on our economy and humanity, and some may also have a dark side.
One of the most frequent mistakes investors make – both professional and non-professional – is not being prepared for the range of possibilities likely to come.
When you are surprised by a particular outcome, your emotions take over. Emotional decisions are often based on feelings rather than data. Decisions based on emotions are more likely to deliver regrettable decisions when compared to decisions based on data and logic.
To avoid surprises as much as possible we must be aware of the range of outcomes possible, and that the many outcomes possible are changing and evolving. This allows us to be prepared to react intelligently when the outcomes are favorable, while safeguarding our capital when the outcomes are unfavorable.
The goal, or first rule of investment logic is to make sure our assets remain our assets, regardless of what confronts us. To do this we must be aware of the direst circumstances – so we are not surprised when overly positive or negative events become reality. In short, avoid emotional decisions in favor of decisions based on data and logic.
One of our goals today is to widen the widen the aperture defining the range of outcomes you might expect, and to decrease your surprise factor.
Slide 2

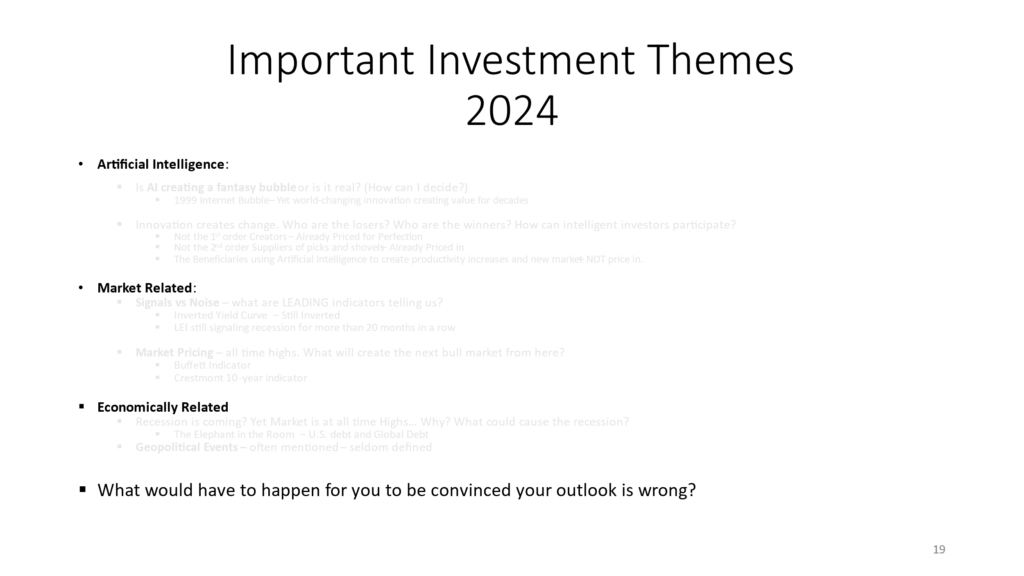
We have divided our themes into 3 categories.
Artificial Intelligence themes
Market Related themes
Economic Themes
As informally said in the beginning, our goal is to provide you with a framework of expectations based on the most recent events and technology. As the framework changes, we will update you on the most likely changes in the expectational framework.
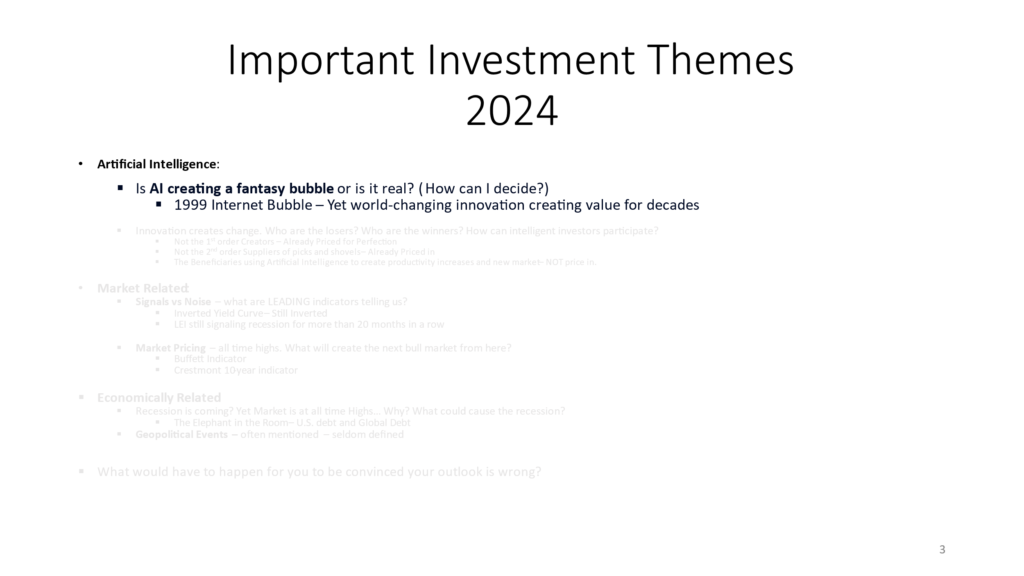
Slide 3
So, let’s jump in with the first topic dominating our press and for some, a goodly portion of our day. Artificial Intelligence and its impact on business and eventually on our social life.
The first thing I can tell you is that Artificial Intelligence is real. It is a giant leap forward for everyone. It really levels the field of play for everyone having access to a computer and a good dose of curiosity as it instantly offers everyone nearly all of the intelligence (and nonsense at times!) created since the beginning of the written word. And it arranges the information you request in a language you can understand (and if the information is not well-stated, it never tires of your asking the question again in a slightly different way).
Note: I can also tell you it is unlikely to be as impactful as mankind’s disruptive achievements such as the written word, electricity, the transistor/semiconductor/computer, and the internet. Artificial Intelligence is an incremental technology in our opinion (and certainly at this stage) as it magnifies the value of the computer and the internet, it does not obviate either.
Artificial Intelligence, like all significant leaps forward, will change our world. As a rule of thumb, in the beginning progress often becomes overhyped. This is the case today.
So, our first theme today is Artificial Intelligence.
It is real.
It is going to change the way we act and manage our daily business and eventually social lives.
Yet it is – and will likely remain – overhyped today, and until it becomes integrated into our lives.
So, as with all of our themes, we wanted to describe where to look for avenues which will allow us to participate in this wonderful technology, while avoiding the risks of committing our capital to companies which have already priced in the future’s gains.
Here is how we see it.
Slide 4
There may be several layers of beneficiaries from this technology.
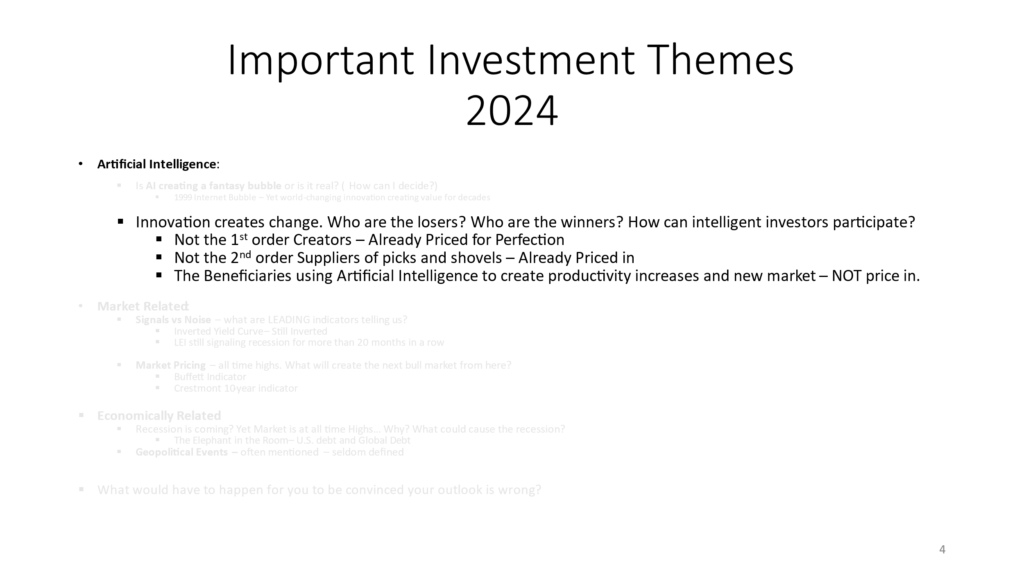
Artificial Intelligence’s first layer of beneficiaries consists of those who created the technology. For example, OpenAI, Google Deep Mind, Anthropic – and many more. Most of these companies – we will call them “platforms,” are richly valued and have priced in a level of success which is rarely achieved. We would label this first layer of beneficiaries as priced for perfection, and as such, will advise you to leave this layer of Artificial Intelligence investing to those on the inside.
The second layer of the Artificial Intelligence buildout references the picks and shovel suppliers – or – those supplying the infrastructure of the Artificial Intelligence process – think semiconductors and powerful computing centers. This layer of Artificial Intelligence is also priced for perfection as we see it. So, we would avoid this sector unless there was a significant global event that decreased the prices of all public companies – including the second layer of Artificial Intelligence beneficiaries. Make note, those companies offering the supplies and equipment needed to build the infrastructure supplying Artificial Intelligence will benefit in a meaningful way. However, eventually infrastructure becomes cyclical. Unless you can buy those supplying the picks and shovels of the Artificial Intelligence buildout at a price which allows you to participate in the industry’s growth, it will remain a good industry, and an overpriced investment.
However, there is a third level of beneficiaries – and this layer has not priced in the benefits of Artificial Intelligence.
I am describing the many companies with visionary leadership that will find ways to use Artificial Intelligence to lower costs, increase productivity, and create new products which will change our world.
Examples:
Biotechnology: Why? Faster molecule identification, reduced clinical trial time and expense, more effective marketing for patients.
Energy companies: Why? Increased productivity, lower costs, clever methods to increase carbon capture, and potential to integrate renewable energy into humanity.
The list goes on and includes cybersecurity, the pharmaceutical industry, advertising and almost every industry…
I could go on and on, yet the principal to apply to this thematic approach – find an industry which could benefit from Artificial Intelligence’s leverage, with management committed to integrate technology into their business. As always, management is the key to understanding and implementing this technology into every layer of the business.
The dark side of Artificial Intelligence is that productivity improvement likely means fewer employees doing more business. This has the potential to create significant improvements in productivity on the one hand. On the other hand, it will create disruptions for many. However, retraining, and new industries are likely to offer opportunities for those motivated to get ahead.
If you would like to discuss this a bit more privately, please give me a call.
Let’s move to the next theme today – Market Related themes as these themes will impact everyone on this call in one way or another.
Slide 5
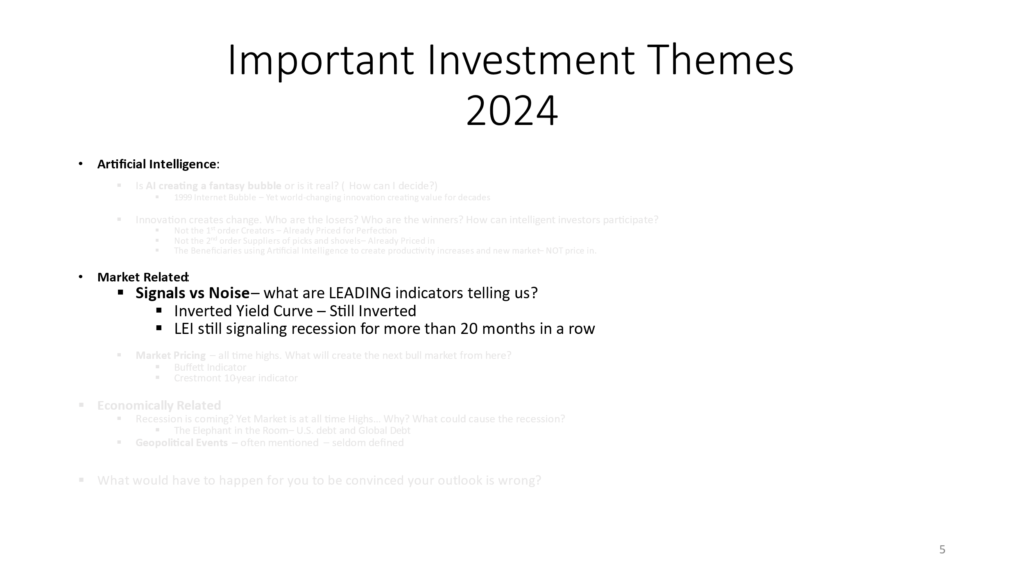
Understanding how busy everyone on this call is, I want to take a moment to again preach the virtues of focusing your attention on the Signals – which offer information about the future, and rejecting the information we categorize as noise, as the noise consists of either lagging indicators – with no information about the future, or largely irrelevant, yet momentarily interesting information. Irrelevant information should have no place in your data-based decision making regarding your investments.
To this end, the two most reliable leading indicators are the Inverted Yield Curve, and the Leading Economic indicators – both of which continue to signal a recession to come.
Let’s take a moment to determine what each of the most relevant leading indicators are telling investors today.
Slide 6
Here is a table describing the various maturities of our U.S. Government bond market.
As you can see below, the shorter maturities of the bond market are yielding more than the longer maturities.
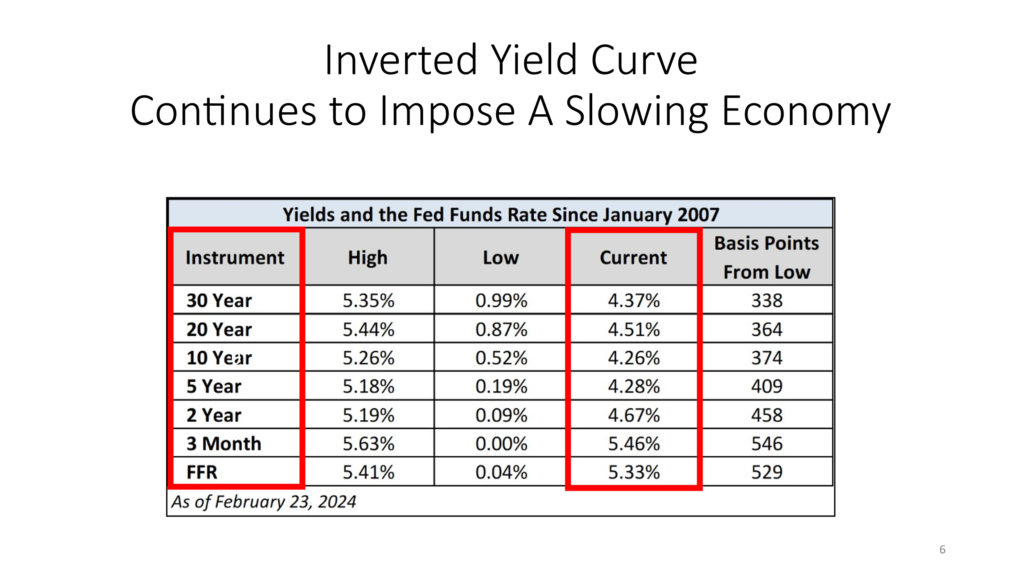
Since banks (and the lending markets) borrow at short-term rates and lend at long-term rates, this clearly signals the U.S. Federal Reserve is doing its best to slow our economy by making it difficult, or at times impossible for banks and lenders to lend money.
With an economy that is based on debt and the ability to borrow, as long as the yield curve is inverted – meaning the short-term rates are higher than the long-term rates, it signals the U.S. Federal Reserve is stomping on the brake in an attempt to slow our economy.
Slide 7
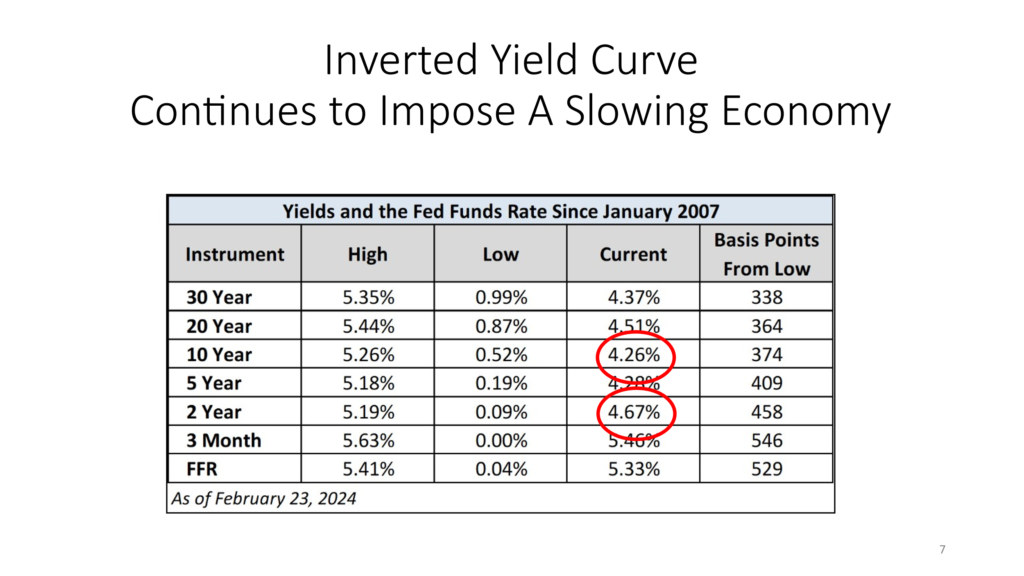
Here we have highlighted to most watched relationship when determining whether the U.S. Federal Reserve is pushing on the gas petal in an attempt to increase our economy’s growth rate or stomping on the brake in an attempt to slow our economy.
This table emphasizes the difference in the 2-year interest rate and the interest rate on the U.S. 10-year note.
As you can see the 2-year note carries a higher interest rate than the 10-year note. What you can’t see here is that the yield curve has been inverted for over 20 months, signaling the U.S. Federal Reserve’s overt, and proclaimed intent to slow our economy.
As most of you know from being involved in the capital markets for decades, over the last 100 years, the U.S. Federal Reserve has seldom lost an initiative. Said differently, when the Fed wants our economy to grow faster or when our Fed wants our economy to slow – the U.S. Federal Reserve seldom loses its battles. The U.S. Federal Reserve is and remains the strongest economic entity on earth.
Slide 8
Here is the Inverted Yield Curve described as a graph. The shaded areas are recessions. The blue line represents the U.S. 10-year interest rate minus the 2-year interest rate.
When the difference between the two is negative, a recession soon follows.
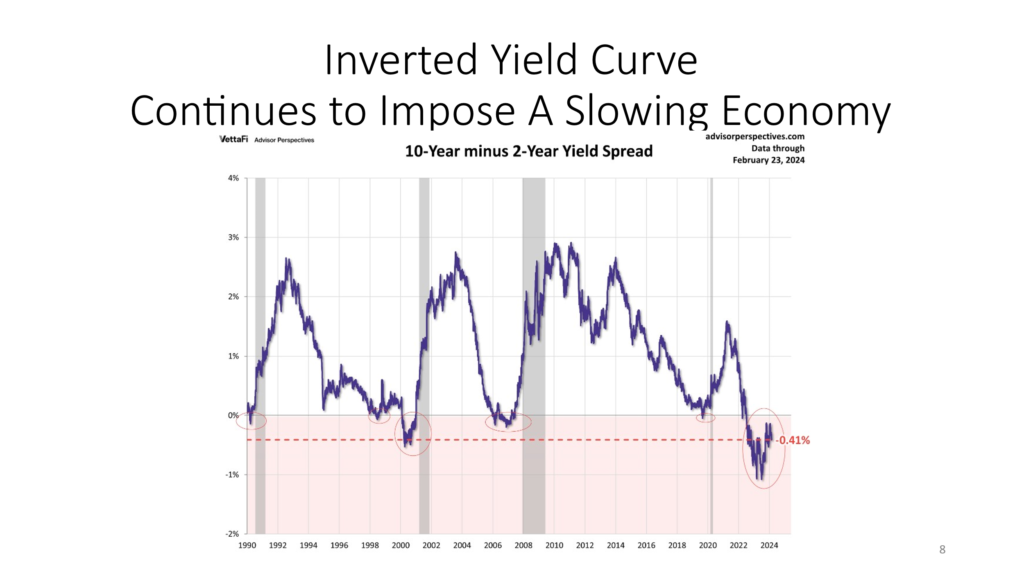
As you can clearly see the 10-year interest rate remains below the 2-year interest rate and has remained below the 2-year rate for over 20 months now.
This is a significantly negative signal and while no signal is guaranteed, it would be unintelligent to bet against this one.
Let’s move to the next reliable indicator which is even slightly more reliable than the Inverted Yield Curve.
Slide 9
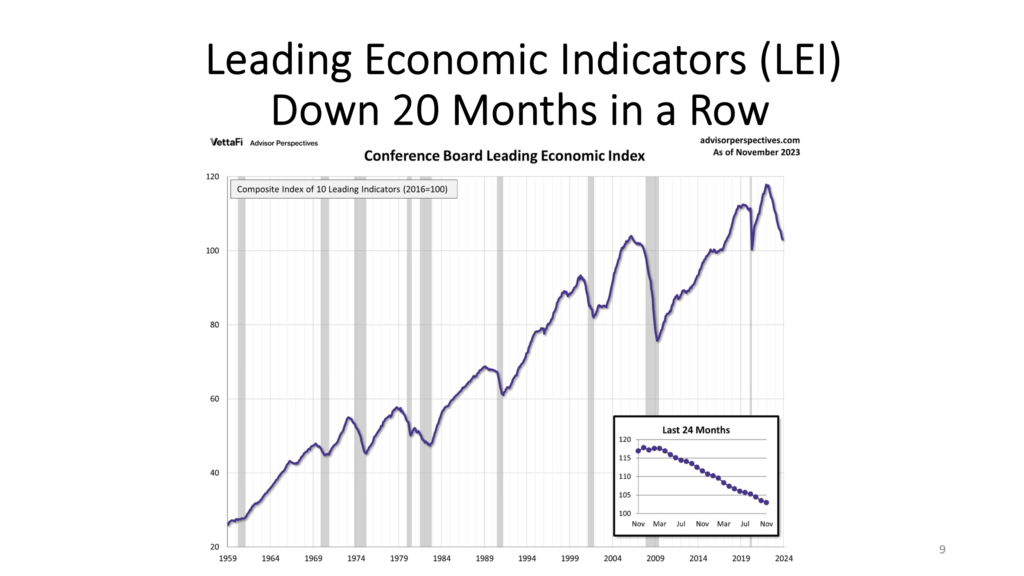
Most of you know I am talking about the Index of Leading Indicators – a compilation of 10 separate and distinct indicators all rolled into one index.
Slide 10
The LEIs also continue to offer negativity for over 18 months now.

History tells us that there is a 100% probability of this signal providing information that a recession is to come.
Of course, as said, when dealing with weather and economics, there is seldom a 100% chance of anything happening as predicted…
However, the LEIs are incredibly dependable. They aggregate a list of 10 leading indicators all rolled into one, which describe the economic fundamentals translating into economic activity to come.
Slide 11
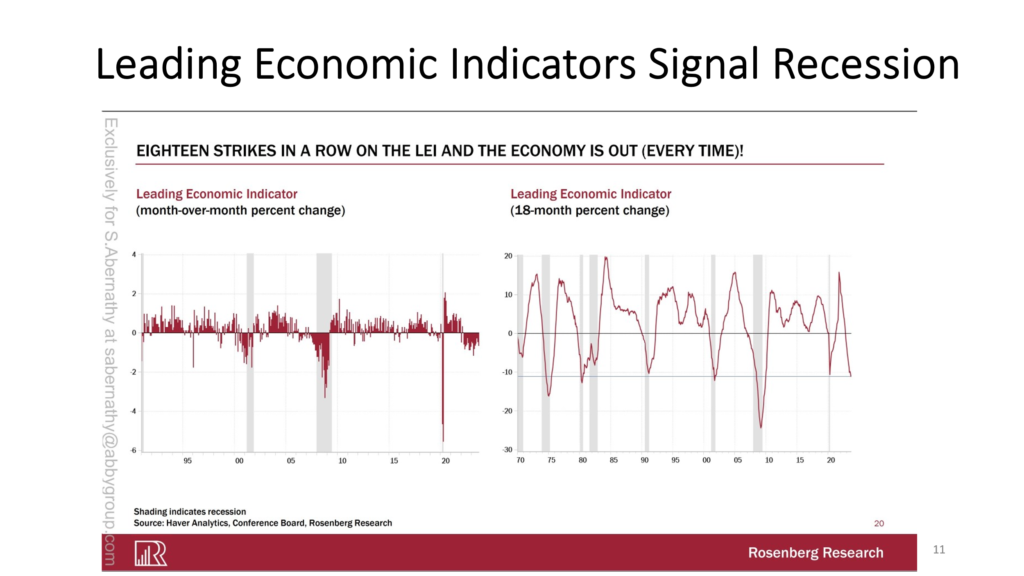
Here we see documented evidence that when the LEI signals recession for 18 plus months we have never avoided a recession, while highlighting the magnitude of the LEIs seems to have a reasonably high correlation with the recession to come.
Slide 12
The chart below juxtaposes the differences between a) the lagging indicators inability to predict the future, while b) the coincident indicators offer a reliable view of where we are currently, while c) the LEIs offer a reliable indication of what is to come.
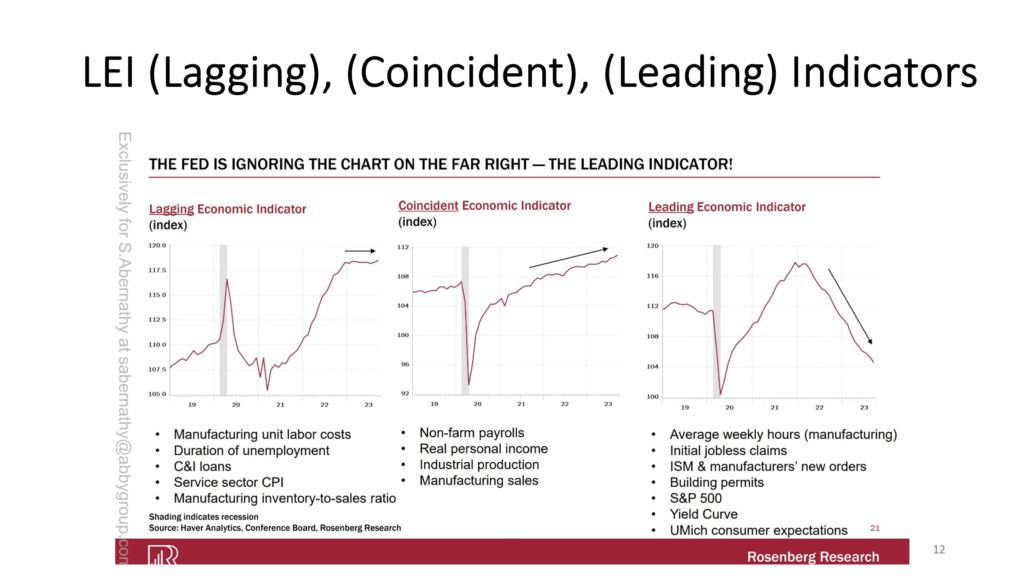
The takeaway from this slide continues to demonstrate that while the lagging indicators show we are in a wonderful environment currently, and the coincident indicators support this view, the likelihood is that headwinds of a shrinking economy are more likely than not.
Slide 13
Let’s spend just a minute or two on the valuation framework offered by the stock market today.
As you will see we continue to remain significantly overvalued, nearly two standard deviations over the mean.
Slide 14
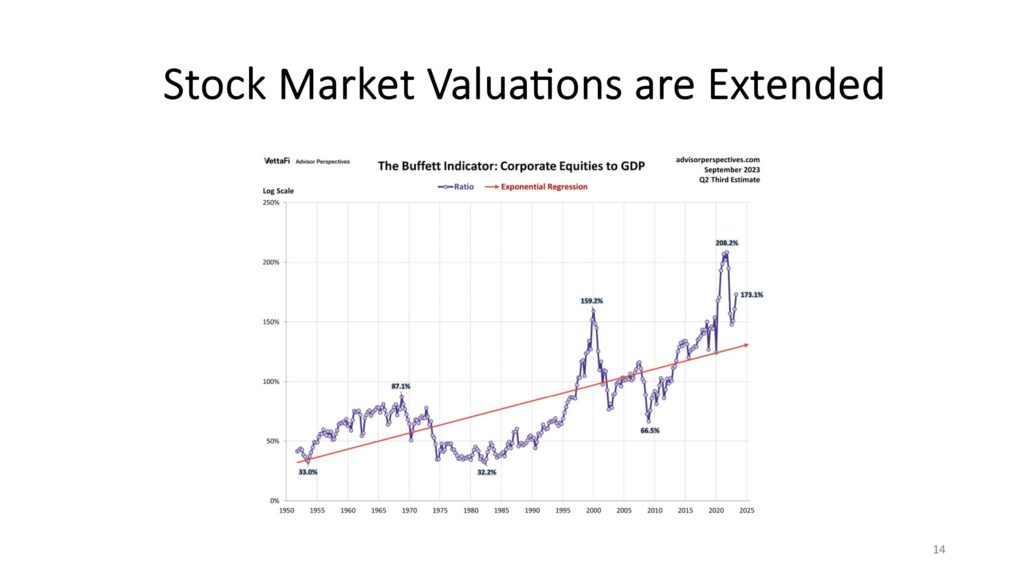
I want to point out – this slide is an average of all stocks in the S&P 500 and this average is based on their market capitalization.
The importance of this statement is that 5-10 incredibly robust companies dominate the market, with outstanding balance sheets and admittedly solid growth rates ahead of them. It leaves the remaining 490 stocks in their own world. This bifurcation is called “market concentration” and is often a signal of a pending downturn, yet it is not a reliable indicator.
The point I want to leave you with is that current valuations represent a tale of two markets.
While the top 7-10 stocks have grown to an incredibly large valuation, and are certainly egregiously overvalued, the bottom 490 stocks might be viewed differently, as many are reasonably valued with strong dividends and strong balance sheets.
The Crestmont 10-year indicator shows the growth already factored into current prices leaves little future appreciation available. So, for those unfortunate enough to be betting their portfolios on appreciation as opposed to current income, disappointment likely waits.
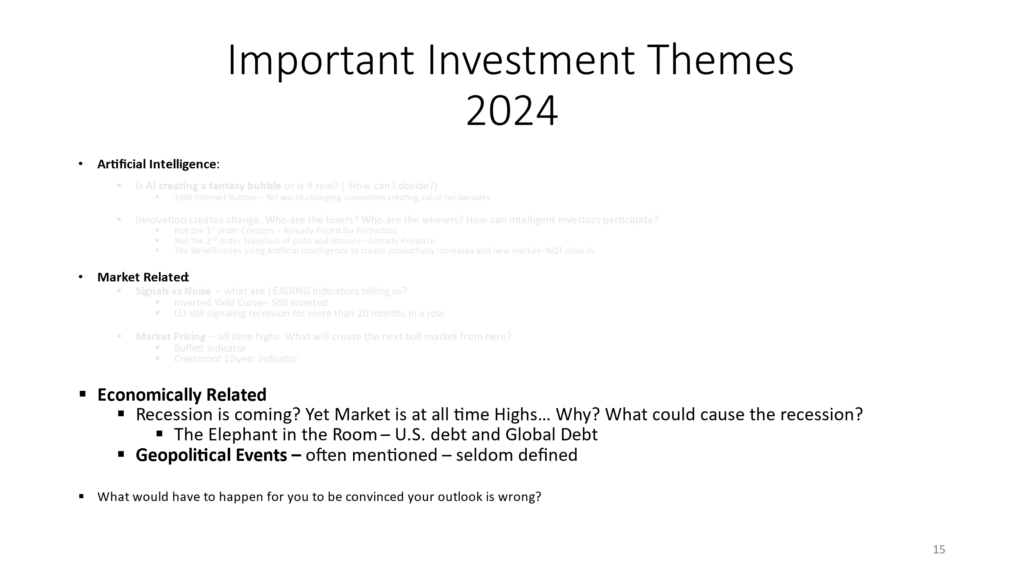
Slide 15
Next – let us wrap up our themes today with a quick macro-economic tour. Reason? Our nation’s current balance sheet shows a record amount of debt, and interest rates at levels which mean the U.S. will owe over $1 trillion dollars (or 25% of our GDP) to interest payments alone in 2024.
Slide 16
We believe textbooks will describe the event we are living through today as potentially being the straw that broke the U.S. camel’s back.
Here, we see that our budget deficit at nearly 10% of our GDP. Our employment is near a record high, indicating no need for government assistance at any level.
It shows our economy is healthy, yet our spending is in a crisis, and our balance sheet is worse.
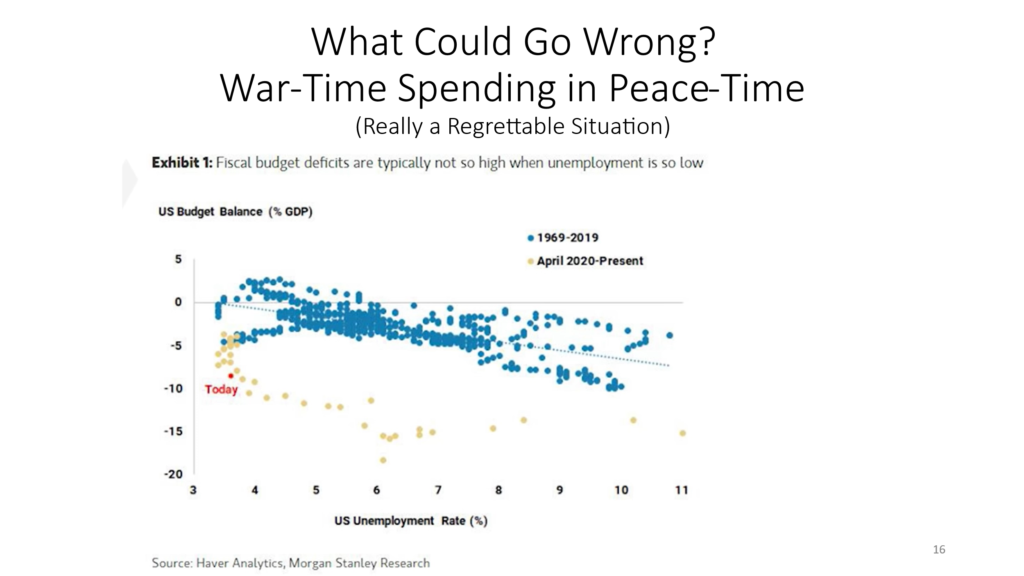
This slide demonstrates the current lack of fiscal restraint our administrations have put the U.S. in. * Please make note, this is not a political statement.
Both Republican and Democratic administrations have put us in this predicament.
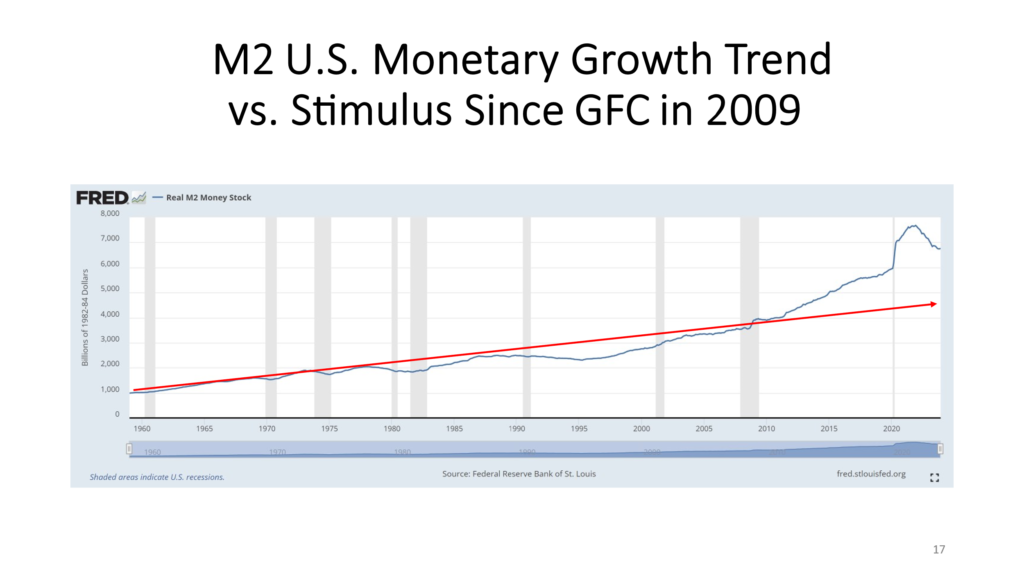
Slide 17
Shown below, we see a slide we called your attention to last month. It shows the trend line in red, and the reality in blue. The only description which fits when describing this chart is that our budget deficit is unsustainable, and our budget deficit is unsustainable. This combination means pain is ahead – yet no one can tell us when or what will create our fate.
Let us suggest one quick topic before we leave this slide – with a question.
With our current spending deficit (over 10% of GDP and growing), and our current balance sheet showing $34 trillion in debt, what will our country do if we go into recession?
Remember, during recessions government spending increases to bail us out of the recession while tax receipts fall significantly as people lose their jobs. Spending grinds to a halt.
Or worse, what happens if geopolitical events force us into war? This would mean government spending goes into overdrive. Deficits are not typically a concern when it comes to defending democracy, yet the U.S. is already borrowing money just to pay its interest payments.
In short, what will the U.S. do if we have a recession or a war?
Slide 18
This brings us to our last topic which was requested by one of the most astute observers we have in our Family Office. In essence he was justifiably calling me on the fact that we always mention geopolitical events and natural events as being a risk, yet we never quantify these risks.
So, on the one hand I want to applaud him for always keeping me on my toes, and on the other hand I want to do my best to find evidence that might help all of us develop expectations which are reasonable if/when a geopolitical event takes place.
We went back to the last geopolitical event – the beginning of WW2 and got a chart showing the market performance during that period – before, during and after.
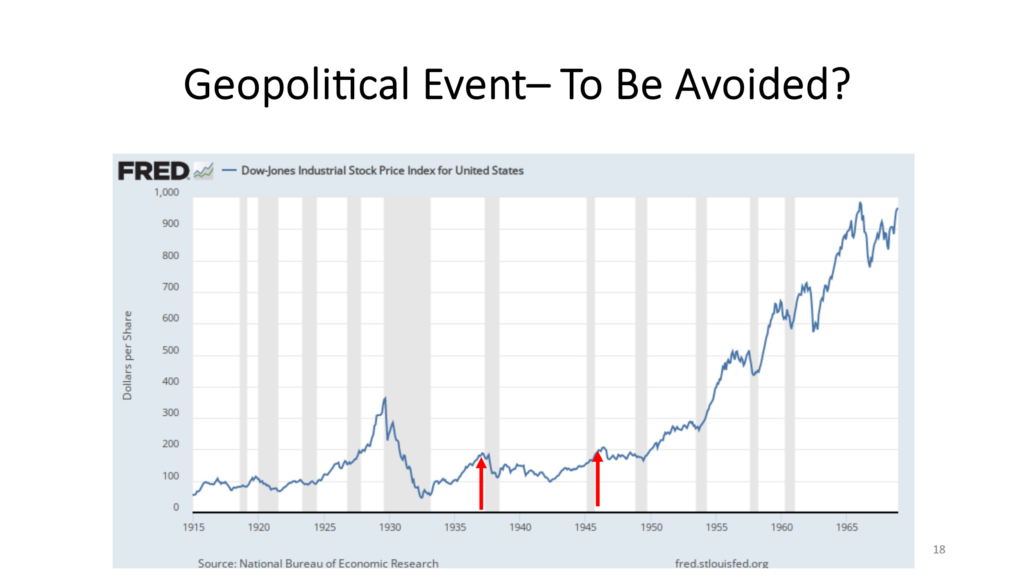
And what we find is that despite lots of ups and downs during WW II, we experienced two recessions; our deficits exploded to over 100% of GDP. And the consequences? Investors had a decade of no returns along with the cost of some truly scary moments. While we would like to avoid a decade of no returns, with months of fear reminding us of the potential for life-ending events, history seems to offer a reasonable tradeoff for avoiding a nuclear war.
There is one significant problem with this scenario, and this is why geopolitical events are always the topic that keeps me up at night – always.
Today, our debt load is at 130% of our GDP. During WWII, our debt was barely 20% of GDP.
Firstly, the U.S.’s economic position is unlikely to afford us the ability to borrow 100% plus of our GDP again.
Secondly, and more importantly, today we have nuclear power to change the face of the earth five times over. We fight our wars withdrones. We create cyber-attacks on enemies banking systems. And let us not forget, if – and more appropriately – when, someone figures out how to disrupt our electrical grid – shutting down our electrical systems nationwide and access to all power, it will shut down our access to water, food, and transportation.
So, while I am NOT trying to be a glass half empty person – I want to remind us that our country remains among the strongest military powers on earth. Our country is protected by oceans on either side of us. Yet, the world has become smaller and with technology – cyber-attacks will become the norm, not the outlier.
Slide 19
What could happen to change your mind about the Leading Indicators as being wrong?
The answer is that the enormous amount of liquidity in the economy is allowing our consumers to continue to spend.
If our government can continue to find ways to continue to spend more than it earns, the best of times can, and should, continue. However, if our consumers can continue to spend, inflation will likely be more persistent, and the market is not priced for that scenario.
I am not trying to dodge the question, I am just trying to let you know that the lagging effects of the stimulus, the forgiveness of rent and school loans along with the $7 trillion of excess cash pushed into our economy have never been experienced before. So, we are seeing results which fall into the “uncharted waters” territory.
By the way, inflation is NOT coming down. It is just increasing less robustly.
Every day that our U.S. Federal Reserve keeps rates at current levels, it increases the odds of something in our economy breaking. And it increases the odds of other economies breaking also.
The UK, Germany, and Japan are already in declared recessions, with any number of countries in South America also in recession. Canada may already be in recession, and each geography around the world will have an impact on the U.S.
I remain cautious and strongly believe we have not avoided a recession.
I do believe the U.S. Federal Reserve will come to our rescue when recession hits or when something in our economy breaks.
I want to be on the record as saying – I believe we will get through this downturn. I see it as probably a light recession because the U.S. Federal Reserve and the administration will funnel vast amounts of money into the economy.
The problem is that we will not have fixed any of the problems plaguing our economy – mainly our debt load –
This will make the coming recessions more frequent and more dire. We have successfully delayed our pain; we have NOT avoided the pain. We must become responsible and fix our problems.