
By: Steven Abernathy
Download a PDF version of this article
Three misconceptions can derail retirement plans.
Over the years, I have discussed investment strategies and their relationship to retirement planning objectives with thousands of medical professionals. Inevitably, they want to focus the conversations on investment returns. And while investment returns are certainly important, I suggest a more immediate, and ultimately a more critical consideration, is lowering portfolio risk. The concept of lowering risk without disturbing returns may initially appear to be a secondary consideration, but the retirement planning process can be little more than an exercise unless investor and asset manager agree on a strategy to lower the potential for big portfolio losses. In this article, I’ll explain how to invest for a comfortable retirement by limiting risk.
Have Realistic Expectations
Many medical professionals who expect to be financially secure at retirement share some common misconceptions. They expect:
- to maintain their current lifestyle after retirement, based on their investable assets
- investment portfolio gains of at least 12%-15% a year
- positive portfolio returns every year.
The more realistic approach to retirement planning, one that sidesteps these myths, involves asking some hard questions, such as:
- Will it take more money than I expect to maintain my current lifestyle after retirement?
- Will my retirement portfolio grow as fast as I would like?
- What effect will a losing year have on my retirement portfolio?
Let me try to answer these questions.
How Much Will I Really Need?
At an after-tax annual return of 3%-5%, it will take $5-6 million in investable liquid assets for most medical professionals to retire comfortably. This excludes residences and other nonliquid assets that tend to be included when calculating “total net worth.” Among the hundreds of medical professionals I have spoken to at financial seminars and conferences, only one in 15 expects to have that much set aside for retirement. Most are amazed when they see the hard numbers.
Although moderate in recent years, inflation remains an issue. Even at a modest 3% annual inflation increase, an ophthalmologist who currently requires $10,000 monthly income will need $16,000 per month by the year 2017, just 11 years from now. It would take at least $4 million in invested funds at 4% annual tax-free return to realize $16,000 per month, and that amount does not provide for any significant increases in personal health expenses, which are likely.
Consider also that healthcare pricing pressures continue to lower payments to practitioners, who are faced with the choice of working harder to maintain their current lifestyle or accepting a reduced living standard.
What Rate of Return Can I Expect?
A common misconception exists among virtually all investors regarding portfolio returns. They significantly overestimate what they will earn in the markets. Over the past century, the S&P 500 Index has returned roughly 10% annually before taxes. But that figure is deceiving.
First, there are management fees that eat up roughly 1.25% of that 10%. Expenses (transaction costs that may be buried but nonetheless are very real) devour another half point or so. Even if an investment manager is able to match S&P returns (and most don’t), an investor’s best-case returns after fees and expenses are likely to be closer to 7%-8% annually. From that, taxes will eat up as much as another 35%, leaving the raw reality of a 5%-6% net annual gain.
Given the historic precedent, there is no reason to expect these averages will change much in the next 100 years. Investors who plan on after-tax annual returns of 12%-15% impose an enormous discrepancy on their retirement plan.
What about bonds? At 6% annual return over the past century, bonds are no better. Taxes knock that return down to about 4% annually. Inflation reduces that even further. Another element that is rarely considered is speculation. I refer to the fact that virtually every medical professional I have spoken to over the past 20 years considers themselves a “better than average” investor. (It makes you wonder where the average comes from.) The reason for this seems to be that people have selective memory when it comes to investments. Their successes are permanent recollections; their losses are more easily forgotten.
“I Won’t Have Losing Years”
Losing years are portfolio killers. No one anticipates losing years, but few portfolios avoid them. The time required to make up for a losing year is far longer than most investors realize.
In working through retirement projections with clients, I find most are unaware of the devastating impact even an occasional big loss can have on their portfolio. Consider an aggressive investor — let us call him the “Hare” — with a high tolerance for risk. Occasionally, his risky strategy pays off big time. In a year when the stock market gains 12%, he makes 50%, a delicious retirement plan boost. The next year, the market drops 12% but the Hare’s aggressive strategy plunges his portfolio 50%. The Hare is upset, of course, but figures at least he is no worse off than when he started.
Correction. He is worse off — much worse off.
His $1,000,000 grew to $1,500,000 at the end of year 1, but his 50% loss in year 2 leaves him with just $750,000 — a 34% overall loss which he has to make up just to get back to even. At an annual return rate of 6%, getting even would take 5 more years (see Chart 1 below). That assumes he does not suffer another losing year during the makeup period. Overall, he endures a 7-year-span with less than net zero performance once inflation is factored in. No one I have ever met factors that disastrous possibility into their retirement plan, but obviously, an inconsistent return profile will cripple any retirement planning effort.
By comparison, a risk-averse investor — the “Tortoise” — employing a hedging strategy that protects against large losses, settles for a steady if unspectacular annual return of 6%. The same $1,000,000 portfolio reaches $1,500,000 at the end of seven years. Granted, the Tortoise can’t brag about any 50% upside years, but he never had to worry about recovering big losses because there weren’t any big losses. He also slept well, knowing his core assets were safe. How much is that worth?
When the “Hare” represents a couple already retired, the impact of losses is doubly devastating because the couple is spending down their portfolio while it is simultaneously losing money.
Recognizing Real Risk
A healthcare professional client of mine came to me recently and said he planned to move a portion of his equity portfolio to a “hot” manager someone recommended. It seems the manager had outperformed our portfolio by some 25% over the past year.
I asked what the manager’s “capital at risk” ratio was.
He stared at me blankly. “I don’t know from capital at risk. What I do know is his returns were higher than mine and his strategy seems comparable, so I assume the level of risk is also comparable. That’s good enough for me.”
His one-dimensional analysis was preoccupied with returns, ignoring the effects of inevitable losses. If an investment manager makes money 75% of the time, it sounds impressive. However, that means investors will lose money one period in four — a statistical certainty. The effects of even one losing year in four can be substantial, but investors tend to dwell on how much they will earn and ignore how much they might lose.
What to Do?
Some portion of a retirement portfolio should be in vehicles that do well in down markets. In recent years, a notable shift has occurred among seasoned institutional investors. They have moved from mutual funds and long-only managers to those who can hedge and profit in down markets. According to a front page story in the Nov. 27, 2005 New York Times, “Pension plans and other large institutional investors are expected to invest as much as $300 billion in hedge funds by 2008, up from just $5 billion a decade ago.” Hedge fund managers typically have less capital at risk than traditional or long-only managers.
Exactly how does a manager reduce capital at risk through hedging strategies?
Here’s a simplified example. Two managers. The first buys XYZ at 100 believing it is worth 125 and that the stock will eventually reflect that belief. His capital at risk is 100%. Manager number two, using a reduced capital-at-risk strategy, also buys the XYZ stock at 100, but also buys a protective “put” option guaranteeing the right to sell the stock at 90. If an unforeseen event occurs — a terrorist attack, oil embargo, the CEO goes down in a plane crash — and the stock plummets to 30, the manager’s investors only participate in the drop down to 90. The exposure or capital at risk is limited to 10% of the portfolio vs 100% for the unhedged portfolio, while retaining the entire upside potential.
Managers who hedge scrutinize the various market sectors, analyzing which companies are likely to outperform or underperform within each sector, going long on stocks they think will outperform and an equal amount short on those they expect will underperform their counterparts. If a catastrophic event causes the market to collapse, no matter how smart you are or what you have done to protect it, part of your portfolio is going to take a similar hit. On other hand, the stocks that were shorted will also go down so overall, the portfolio has stabilized with little or no loss. Should massive negative shocks occur, the portfolio is perfectly hedged.
Another simplified example of reducing capital at risk would be to choose three or four stocks expected to outperform the market and then short the corresponding index.
Chart 1
| Tortoise vs. Hare | ||||
| Year | Return | Aggressive | Return | Conservative |
| 0 | Hare | $1,000,000 | Tortoise | $1,000,000 |
| 1 | 50% | $1,500,000 | 6% | $1,060,000 |
| 2 | -50% | $750,000 | 6% | $1,123,600 |
| 3 | 6% | $842,700 | 6% | $1,191,016 |
| 4 | 6% | $840,270 | 6% | $1,262,477 |
| 5 | 6% | $893,262 | 6% | $1,338,226 |
| 6 | 6% | $946,848 | 6% | $1,418,520 |
| 7 | 6% | $1,003,670 | 6% | $1,503,631 |
Buffet Had it Right
Much as a team of medical professionals works together to treat a complicated illness, understanding and defining what Warren Buffet calls your “Circle of Competence” is the key to building a team of competent advisors to help you navigate the years between today and your retirement. One member of the team is an investment advisor to help you construct various retirement scenarios, determine necessary annual contributions and manage assets within your personal risk tolerance and investment model preferences.
There is no one “right” investment advisor for everyone. It’s important to know you, your advisor and the other members of your team are all on the same page. Advisors with large amounts under management can seem like a safe choice because so many other investors have already chosen them, but the more money a manager takes in, the harder it is to deliver performance above broad market returns. While typically not an investor’s first consideration, a record of minimizing capital at risk may be the most important aspect of an advisor’s resume. That is because you must always safeguard your investable asset base. There is no opportunity for future returns without investable assets. Obtaining returns should be the secondary priority.
Two things you can do today to put your retirement plan on track and avoid the most common myths of retirement planning:
- Adopt a long-term investment approach, a strategy that includes the protection of hedging against losses that can decimate your retirement assumptions. If you anticipate net annual returns above 6%, stop kidding yourself. Don’t put off implementing a strategy embracing a more realistic approach. Every year you delay making the adjustment in your calculations is time lost forever; time you should have been saving more money.
- Have as little of your capital at risk as possible. In most years, it is better to have a 6% return with only 30% of your capital at risk than getting a 10% return while risking all of your capital. The portfolio with the least capital at risk is best insulated against inevitable market dips.
Sidebar: It’s the Losses, Stupid
Remember the famous sign in Bill Clinton’s presidential election offices, “It’s the Economy, Stupid”? Perhaps every investor should have a similar sign on their desk, one that reads, “It’s the Losses, Stupid.” It would be great reminder to pay attention to portfolio capital at risk.
Chart 2
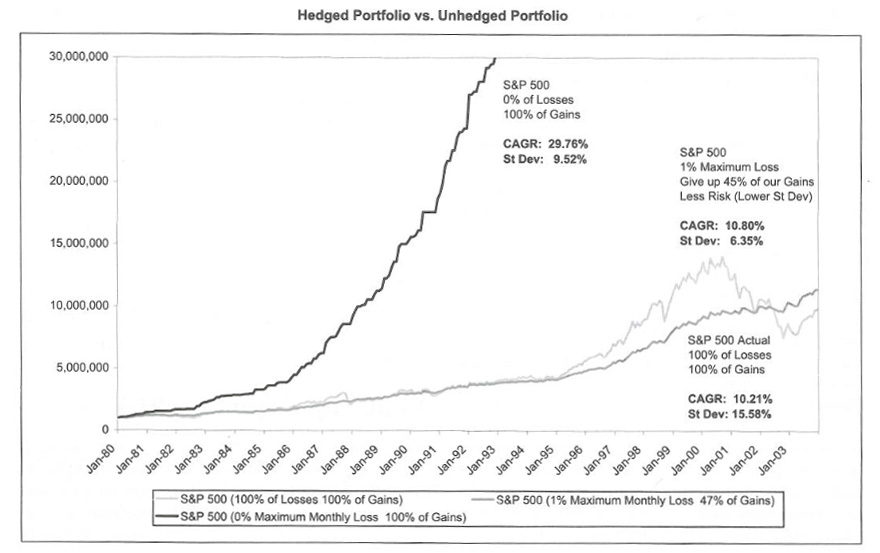
Take a look at Chart 2. It depicts three variables of a $1,000 investment in the S&P 500 index since 1980.
The black line is a projection of the S&P gains since 1980 without any of the losing months. Of course, that’s a purely hypothetic assumption since the S&P did have many losing months over the past quarter century.
The turquoise line depicts the actual S&P performance, including both gains and losses. A $1,000 investment in 1980 would have grown to about $10,300 — an average compounded annual return (CAGR) of 10.21%. Pay particular attention to the S&P’s Standard Deviation of 15.58%. It’s an all-important measurement of risk.
If you studied Statistics in college, you will recall that Normal Deviation, doubled by the Mean, encompass 95% of all outcomes. So to calculate the probably returns on the S&P, double its standard deviation of 15.58% (= 31%) and subtract that from the S&P CAGR of 10.2%, which equals -20%. On the high side, add the same double standard deviation of 31% to the 10.2% CAGR and you get +40%. The inference tells you that 95% of the time, the S&P will range between down 20% and up 40%. What it also should tell you is that S&P indexed portfolios spend way too much time in the negative area. That’s not where you want to be.
Now look at the dark green line representing a hedged portfolio that mimics the S&P index but with two important differences. First, when the S&P has a down month, the hedged portfolio may also be down, but not more than 1% because of the downside protection provided by hedging. In exchange for that reduced risk, our hedged portfolio actually gives up 45% of the gains!
Whoa! Miss out on 45% of the gains? That seems like a staggering amount to surrender just to lower out capital at risk, doesn’t it? Well, take a look at the hedged portfolio’s standard deviation and CAGR figures. Despite giving back almost half the gains, it actually outperforms the S&P slightly while reducing the standard deviation (capital at risk) by some 60%. The conclusion here is that you can give away almost half the index gains but if you hedge against big losses, you can still outperform the S&P but with much less risk. Avoiding losses is the real key to growing your portfolio.
Steven Holt Abernathy is principal and portfolio manager of New York-based The Abernathy Group, the nation’s largest asset manager exclusively for medical professionals. The firm specializes in asset protection and wealth management. The firm offers Ophthalmology Management readers a free analytic tool to help determine the amount of assets needed to retire under any number of scenarios. Contact the Abernathy Group at 800-342-0956, info@abbygroup.com or at www.abernathyfinancial.com.
Click here to view this article in the original magazine publication